EngageNY
Completing the Square (part 1)
Avoid the trap of memorizing steps when completing the square with a resources that provides a conceptual approach to completing the square. Learners that are able to recognize a perfect square trinomial are ready to complete the...
Balanced Assessment
Para-Ball-A
Analyze the flight of a thrown ball. Learners determine the maximum height of a thrown ball and the time it takes to hit the ground given its initial speed. They continue to review different scenarios with different maximums or...
PBL Pathways
Maximizing Movie Revenue
Can theaters increase profits by raising or lowering ticket prices? Using data from the National Association of Theater Owners, classes consider this question. The project-based learning activity includes both a profit and revenue...
Curated OER
How Long Can You Go?
Eighth graders examine the usefulness of a line of best fit by collecting and graphing data, using a graphing calculator to determine the line of best fit, and making a variety of predictions. They watch a video, then design a...
NASA
Lights on the International Space Station
Groups explore illumination with NASA's Lighting Environment Test Facility (LETF) as a context. Using the TI-Nspire app, groups determine the lux equation that models their simulation. They then use the lux equation to...
Texas Instruments
Exploring Basic Equations
Learners explore equations with constants, variables and with exponents. They identify and define variables, constants, exponents, expressions, and equations, as well as give an example of each. Your class will also draw their...
Concord Consortium
In a Triangle
What's in a triangle? Just 180 degrees worth of angles! Young learners use given angle relationships in a triangle to write an algebraic representation. Using a system of equations, they simplify the equation to a linear representation.
101 Questions
Coins in a Circle
Round and round you'll go! Learners watch as different-sized circles fill with coins. They collect data and then make a prediction about the number of coins that will fit in a large circular rug.
Illustrative Mathematics
Springboard Dive
Dive into this problem that illustrates a real-world application of the quadratic formula. Learners are given an equation that represents the height of a diver above the water t seconds after leaving the springboard. The task is to...
Curated OER
How Alike Are We?
Fourth graders find the range, mode, median, and mean for each of the data sets (height and shoe size). They discuss which measure of central tendency for each data set best represents the class and why. Students graph the shoe size and...
Illustrative Mathematics
Zeroes and Factorization of a General Polynomial
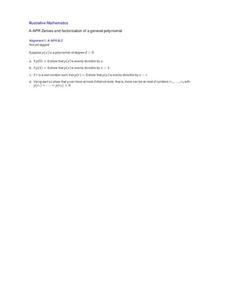
These four problems will guide your class through the idea behind the Fundamental Theorem of Algebra, which states that a polynomial of degree n has exactly n roots. Use the division algorithm and the definition of a zero/root of a...
Virginia Department of Education
The Exercise Fields
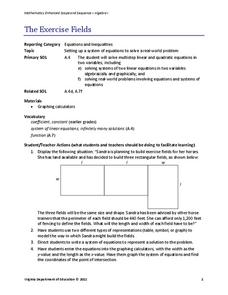
Horses need exercise, too. Scholars create linear equations to model the perimeter of exercise fields for horses. They finish by solving their equations for the length and width of the fields.
Curated OER
Adding and Subtracting Algebraic Expressions (Combining Like Terms)
Everyone loves math when it includes food! This lesson tries to take the notion of combining like terms in algebra and comparing it to sorting apples and oranges. It takes a step-by-step approach to helping students understand this...
Mathed Up!
Transformation of Graphs
In what ways can you transform a graph? An engaging video answers this question as it covers reflections, translations, and stretches of graphs. To test their knowledge, individuals complete a set of problems to apply this knowledge.
Curated OER
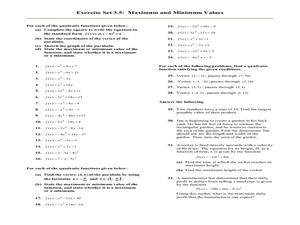
Maximum and Minimum Values
In this Algebra II worksheet, 11th graders complete the square to write a quadratic equation in Standard form. Students identify the vertex, sketch the graph and state the maximum or minimum value of the functions. The one...
Curated OER
Vertical and Horizontal Translations
Students analyze function graphs. In this Algebra II/Pre-calculus instructional activity, students investigate the graph of a function as they determine to which family of functions it belongs, determine the parent function and...
Curated OER
Get a Half-life!
Students explore decay functions and the half-life of a substance. Through an M&M activity with calculators, students collect and graph data. They determine the linear, quadratic and exponential functions of the graph. Students...
Curated OER
Worksheet 32 - Fall 1995
In this math worksheet, students find the area enclosed by the parabola’s arch and the x-axis. They are asked about the highest point of the parabola in terms of a.
Curated OER
Lesson 1: Exploring Quadratic Graphs
Students, using a specified website, plot quadratic curves to distinguish how different values of a affect a graph. They investigate how the constant and the absolute value of a function affects the graph. They identify the parabola...
Curated OER
Calculus 30: Domain and Range
In this domain and range worksheet, students find the domain and range of 23 equations. Students find the domain and range from a graph and determine a graph given the domain and range.
Curated OER
Solving Equations
In this algebra worksheet, 11th graders solve a variety of problems using linear and quadratic properties as they pertain to functions. There are 12 questions.
Curated OER
Algebra II Calculator Lab
In this quadratic functions worksheet, students use their graphing calculators to solve the 9 problems on the page. The questions ask students to graph functions, compare graphs, find the vertex and axis of symmetry and more.
Curated OER
Properties of a Parabola
In this algebra learning exercise, students identify the properties of a parabola. They factor and graph quadratic equations. There are 18 questions.
Curated OER
Graphing Review
in this graphing review worksheet, students solve a variety of problems such as interpreting parabolas, identifying intercepts and asymptotes, and identifying functions. They solve piecewise functions and rational functions. This twenty...


