Curated OER
Adding and Subtracting Decimals
Students practice adding and subtracting numbers with decimals. For this decimals lesson plan, students use grid paper and money to learn how to add and subtract decimals.
Curated OER
Triangle Dot Paper
In this math worksheet, students see a whole page grid of triangle dots. There are no directions on the page which is labeled as a learning tool for grade 6.
Curated OER
Centimeter Grid
In this learning tool worksheet, 6th graders will draw or depict information on a blank centimeter grid. There is a space for name and date at the top.
Curated OER
Math Grids
Fourth graders read an article, then search for verbs, adverbs, nouns, pronouns, etc. In groups, they exchange papers and try to guess what the other poem was about.
Curated OER
Symmetry (Bug)
Play around with symmetry with this worksheet! Learners examine an image of half of a bug drawn on grid paper and complete the drawing, making the image symmetrical. The bug contains curved lines as well as patterns to copy over to the...
Curated OER
Adding and Subtracting Decimals
Help your 4th through 6th graders add and subtract whole numbers with decimals. Using grid paper and a Promethean Board, this resource will provide material for practicing and reviewing this concept.
EngageNY
Decimal Expansion of Pi
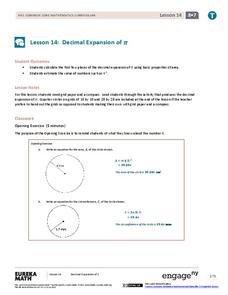
Develop a better understanding of the value of pi. Learners explore the area of a circle using estimation and graph paper. While continuing to estimate the area of the circle using smaller and smaller grids, the number pi emerges.
Curated OER
Two for One Box Company: Student Worksheet
Fifth and sixth graders work alone or in pairs to determine the volume of paper boxes of various dimensions. Pupils write ratios of dimensions and volumes.
Curated OER
Counting Area
In this math worksheet, students find the area of shapes by counting the number of grid paper squares inside each shape. This is a worksheet generator, the teacher controls the complexity of the shapes as well as the grid size. Answers...
National Math + Science Initative
Introduction to Decimals
Three activities make up an introductory lesson designed to create a strong foundation in comparing fractions to decimals and exploring and building decimal models. Pupils brainstorm and complete a Venn diagram to show how decimals and...
Curated OER
Vegetable Print Patterns
Create a unique print using vegetable stencils and tempera paints applied to grid like pattern formed from cut pieces of paper. Your students will choose either a warm or a cool color scheme.
Curated OER
Timothy's Trip
In this route worksheet, learners draw the route Timothy took on his trip based on the information given. Students draw the route on graph paper where each point equals 4 miles.
Curated OER
Coordinate Planes
Identifying the location of ordered pairs on coordinate planes is the focus in the math lesson presented here. In it, 4th graders are introduced to coordinate pairs, the x/y axis, and the techniques associated with this type of graphing....
Curated OER
10 x 10 Grid
In this math worksheet, students examine a grid with 10 squares across and 10 squares down. There are no directions or problems on this math tool paper.
Curated OER
Inch Grid
In this learning tool activity, 6th graders will draw or depict information on a blank inch grid paper. There is space for name and date at the top.
Curated OER
Traveling aroud Our Town
Students are asked to describe to a partner how he or she walks to school or the bus stop. They are shown on the overhead an one-inch grid paper, and at the intersection of two lines on the grid paper, students are shown a house and...
Curated OER
Grade 3: What Can I Make with 30 Centimeters?
Third graders create polygons with perimeters of 30 centimeters, use the centimeter grid paper to determine the area of each shape, and organize the shapes to make generalizations from the patterns they see.
Curated OER
Multiplication Versus Addition
Second graders create arrays to study multiplication. In this multiplication lesson, 2nd graders split into teams to complete a multiplication table. One team uses addition to solve the table while the other uses multiplication. Students...
Curated OER
Graphing the Forecast-Line Graph or Bar Graph?
Students explore bar and line graphs. In this data collection, graphing, and weather lesson plan, students compare bar and line graphs and discuss which type of graph would be most appropriate for displaying a ten day weather forecast....
Benjamin Franklin Tercentenary
From Ben’s Pen to Our Lives
What would Ben do? Jumping off from the pseudonymous letters Ben Franklin fooled his older brother into publishing when he was still a teenager, young literary lovers dive into acting, writing, and addressing a local issue with wit and...
Curated OER
Mapping the Bone Field: An Area and Scale Exercise
Here is an excellent cross-curricular lesson. Learners relate multiplication to area by making a grid on graph paper, and then creating the same grid in real space outside in the school yard.
Curated OER
Point Comparisons
Young geometers investigate two-dimensional figures using coordinate grids. They identify polygons and draw examples of their reflection, rotation, and translation on a coordinate grid. And they complete a worksheet practicing examples...
Virginia Department of Education
Curve of Best Fit
Which function models the data best? Pupils work through several activities to model data with a variety of functions. Individuals begin by reviewing the shapes of the functions and finding functions that will fit plotted data points. By...
Florida Center for Instructional Technology
Two for One Box Company
Given a box of certain dimensions, young mathematicians must determine if a box that is twice as big, actually holds twice as much. This is a brain-teaser of a problem. The worksheet provides a handy table that has learners calculate the...


