Shodor Education Foundation
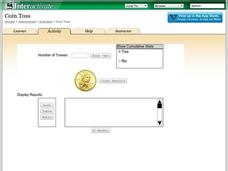
Coin Toss
Are your young mathematicians having a hard time making heads or tails of probabilities? It's no toss up—here is a resource that's sure to straighten them out! Learners run the interactive to toss a coin a different number of times....
Shodor Education Foundation
Overlapping Gaussians
Adjust the overlap to compare probabilities. Using sliders, learners adjust the shape of two Gaussian curves. The interactive calculates the area of the left tail for one curve and the right tail for the other. Pupils set the interactive...
Shodor Education Foundation
Rabbits and Wolves
A change in a parameter can end in overpopulation. The resources gives pupils the opportunity to control the parameters of rabbits and wolves in a natural setting. Using the set parameters, the simulation runs and displays the population...
Shodor Education Foundation
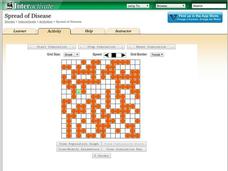
Spread of Disease
Control the spread of a contagious disease. An applet allows pupils to run a simulation on the spread of a disease. Rules govern how the disease is spread and the length of time it takes to recover. Learners view the spread visually and...
Shodor Education Foundation
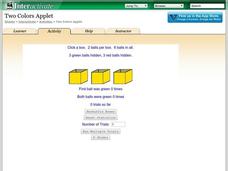
Two Colors Applet
Find the box with two green balls. The applet uses six balls, three green and three red, and hides them in three boxes. Pupils choose a box and click on it to reveal the color of balls inside. Using the chosen box, the simulation keeps...
Shodor Education Foundation
Squaring the Triangle
Teach budding mathematicians how to square a triangle with an interactive that shows a graphical proof of the Pythagorean Theorem. Pupils alter the lengths of the legs using sliders. Using the inputted lengths, the applet displays the...
Shodor Education Foundation
Pythagorean Explorer
Make sure the measurement is right. The interactive provides right triangles with a missing side measurement. Pupils use the given sides and the Pythagorean Theorem to calculate the length of the missing side. After entering the length,...
Shodor Education Foundation
Stem and Leaf Plotter
The key is in the leaves. Pupils enter data to create a stem-and-leaf plot. The resource then displays the plot and calculates the mean, median, and mode of the data. Using the plot and the calculated measures of spread, learners analyze...
Shodor Education Foundation
Skew Distribution
Slide the class into a skewed view. Learners alter the location of the median relative to the mean of a normal curve to create a skew distribution. They compare the curve to a histogram distribution with the same skewness.
Shodor Education Foundation
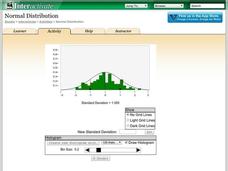
Normal Distribution
Does the size of the bin matter? The resource allows pupils to explore the relationship between the normal curve and histograms. Learners view histograms compared to a normal curve with a set standard deviation. Using the interactive,...
Shodor Education Foundation
Multi-Function Data Flyer
Explore different types of functions using an interactive lesson. Learners enter functions and view the accompanying graphs. They can choose to show key features or adjust the scale of the graph.
Shodor Education Foundation
Multiple Linear Regression
You'll have no regrets when you use the perfect lesson to teach regression! An interactive resource has individuals manipulate the slope and y-intercept of a line to match a set of data. Learners practice data sets with both positive and...
Shodor Education Foundation
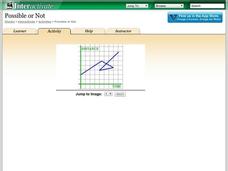
Possible or Not?
What does the graph mean? Pupils view 10 graphs and determine whether they are possible based on their contexts. The contexts are distance versus time and profit versus time.
EngageNY
What Is Area?
What if I can no longer justify area by counting squares? Lead a class discussion to find the area of a rectangular region with irrational side lengths. The class continues on with the idea of lower approximations and upper...
Kenan Fellows
Introduction to a Flight Computer
Keep your hands on the wheel—at all times! Scholars learn why pilots use a flight computer through a high-flying demonstration. Making calculations for speed, distance, or time is automatic if you know how to use a flight computer.
Kenan Fellows
Weight and Balance of an Airplane
A career in aeronautics might be calling your class members. Building from the previous two lessons in the series, learners continue analyzing the mathematics of aeronautics. Groups create a paper airplane using paperclips for balance....
Curated OER
The Very Hungry Caterpillar
Read the story, The Very Hungry Caterpillar, and complete activities from multiple subjects. Make a mural, create a class graph, discuss the life cycle of a butterfly, research information about butterflies on the Internet and make a...
Curated OER
How Credit Card Interest Works
Students experiment with an Excel spreadsheet model that demonstrates the effects of interest on payments. They calculate actual costs, interest paid, and time necessary to pay off credit purchases and draw conclusions about the...
West Contra Costa Unified School District
Introduction to Inverse Functions
Ready to share the beauty of the inverse function with your classes? This algebra II activity guides the discovery of an inverse function through a numerical, graphical, and an algebraic approach. Connections are made between the three,...
West Contra Costa Unified School District
Graphing Exponential Functions
Once you know how to graph y = b^x, the sky's the limit. Young mathematicians learn to graph basic exponential functions and identify key features, and then graph functions of the form f(x) = ab^(x – h) + k from the function f(x) = b^x.
Curated OER
Around-The-World-Zoo
Junior biologists design and maintain a website about a zoo by researching, classifying, and providing the correct habitats for the animals they choose to have in their zoo. This technology-based project can last over an entire semester...
Curated OER
Storytelling: Using the Arts to Enrich the Curriculum...
Students explore the art of storytelling and stories from various cultures. Students experience Japanese and Chinese culture as well as Greek mythology. Students create and present their own Greek mythology topic to the class.
Curated OER
Amusement Park Physics
Learners get up close and personal with principles of motion. In this physics lesson, students collect and analyze acceleration data on amusement park rides. Learners use CBLs to collect data in this lesson.
Curated OER
Wheels for Jack and Jill
Students design, make and appraise a model wheeled vehicle that is capable of carrying a small load. This activity is part of the unit `Wheels in motion'.


