Curated OER
Analyzing Congruence Proofs
Looking at numerous examples of triangles, each with different properties, geometers develop their understanding of congruency. They use the notation of a counter-example to disprove certain conjectures and prove geometric theorems and...
Federal Reserve Bank
Credit Reports—and You Thought Your Report Card Was Important
Get the facts about credit and take a close look at what factors into a consumer credit report with this fantastic lesson. Your pupils will read informational texts, read sample financial documents, and discuss the advantages and...
Curated OER
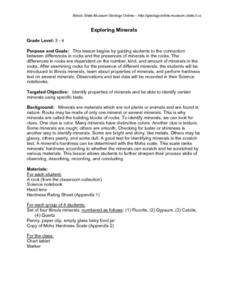
Exploring Minerals
I love this geology lesson plan. Third and fourth graders look at the connections, and the differences, between rocks and minerals. Learners are charged with identifying specific rocks and minerals, learning how to properly use...
Beacon Learning Center
The Fun Polygon
Junior geometers use hands-on manipulatives to explore and describe the properties and attributes of a fundamental polygon, the triangle. They learn different kinds of angles and their measurements. This well-written lesson plan provides...
Curated OER
How Old Is Illinois?
High schoolers use fossils found in rocks to determine the age of the strata between Rock Island and Chicago. Pupils pretend they are geologists. They must determine the age of all rock layers between the Mississippi River and Lake...
Curated OER
Basic Excel
Students explore basic Excel spreadsheets. In this spreadsheet lesson plan, students enter Alaska weather information and perform calculations. Students title the columns on the spreadsheet and format the cells. Students complete...
Curated OER
Correlation of Variables by Graphing
Middle and high schoolers use a spreadsheet to graph data. In this graphing lesson plan, learners determine how two parameters are correlated. They create a scatter plot graph using a computer spreadsheet.
West Contra Costa Unified School District
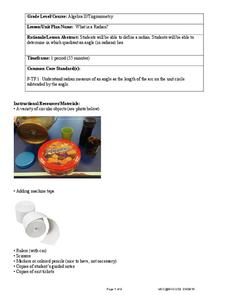
What Is a Radian?
Here's an algebra II activity that strives to make the concept of a radian less abstract and more conceptual. It takes a hands-on approach to exploring the idea of a radian and allows individuals to develop a definition of a radian...
NOAA
Methane Hydrates – What's the Big Deal?
Have you ever tried to light ice on fire? With methane hydrate, you can do exactly that. The ice forms with methane inside so it looks like ice, but is able to burn. The lesson plan uses group research and a hands-on activity to help...
California Academy of Science
Greening Your Middle School
Middle schoolers redesign their school to make it more energy efficient, and create a model of their design. Learners get together in groups of 5, and they take on the task of making their school more energy efficient. To do this, they...
National Research Center for Career and Technical Education
Hospitality and Tourism 2: Costing
The lesson plan provides a richly detailed narrative and sample problems for teaching or reinforcing how to work with percentages. In particular, your audience will compute the costs per serving of food and simulate setting menu prices...
EngageNY
Fluency with Percents
Pupils build confidence working with percents as they work several types of percent problems to increase their fluency. The resource contains two sets of problems specifically designed to build efficiency in finding solutions of basic...
EngageNY
Tax, Commissions, Fees, and Other Real-World Percent Problems
Pupils work several real-world problems that use percents in the 11th portion of a 20-part series. The problems contain percents involved with taxes, commissions, discounts, tips, fees, and interest. Scholars use the equations formed for...
EngageNY
Modeling a Context from a Verbal Description (part 2)
I got a different answer, are they both correct? While working through modeling problems interpreting graphs, the question of precision is brought into the discussion. Problems are presented in which a precise answer is needed and others...
EngageNY
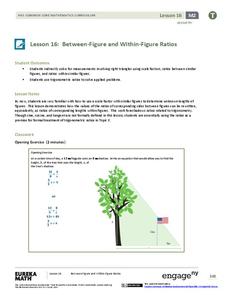
Between-Figure and Within-Figure Ratios
Tie the unit together and see concepts click in your young mathematicians' minds. Scholars apply the properties of similar triangles to find heights of objects. They concentrate on the proportions built with known measures and solve to...
EngageNY
Modeling from a Sequence
Building upon previous knowledge of sequences, collaborative pairs analyze sequences to determine the type and to make predictions of future terms. The exercises build through arithmetic and geometric sequences before introducing...
Education World
Pumpkin Puzzler
Light the Halloween festivities with an exercise that connects math, physical science, and language arts. After watching a demonstration of a burning candle, learners use division, multiplication, or algebra to determine how many boxes...
Math Solutions
Factor Game
Learning about factors and multiples is all fun and games with this simple math activity. The lesson begins with the teacher and class playing the Factor Game together as students figure out the rules and uncover key vocabulary as they...
EngageNY
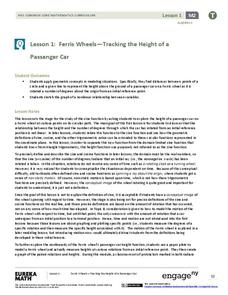
Ferris Wheels—Tracking the Height of a Passenger Car
Watch your pupils go round and round as they explore periodic behavior. Learners graph the height of a Ferris wheel over time. They repeat the process with Ferris wheels of different diameters.
EngageNY
Modeling with Polynomials—An Introduction (part 2)
Linear, quadratic, and now cubic functions can model real-life patterns. High schoolers create cubic regression equations to model different scenarios. They then use the regression equations to make predictions.
EngageNY
Modeling Riverbeds with Polynomials (part 2)
Examine the power of technology while modeling with polynomial functions. Using the website wolfram alpha, learners develop a polynomial function to model the shape of a riverbed. Ultimately, they determine the flow rate through the river.
EngageNY
Analyzing a Data Set
Through discussions and journaling, classmates determine methods to associate types of functions with data presented in a table. Small groups then work with examples and exercises to refine their methods and find functions that work to...
EngageNY
Modeling a Context from Data (part 1)
While creating models from data, pupils make decisions about precision. Exercises are provided that require linear, quadratic, or exponential models based upon the desired precision.
EngageNY
Modeling a Context from Data (part 2)
Forgive me, I regress. Building upon previous modeling activities, the class examines models using the regression function on a graphing calculator. They use the modeling process to interpret the context and to make predictions based...
Other popular searches
- Multicultural Math Lessons
- Dr. Seuss Math Lessons
- Powerpoint Math Lessons
- Thanksgiving Math Lessons
- Esl Lessons Math
- Elementary Math Lessons
- Math Lessons Place Value
- Kindergarten Math Lessons
- 2nd Grade Math Lessons
- Math Lessons Pre Algebra
- Manipulatives Math Lessons
- Halloween Math Lessons


