Curated OER
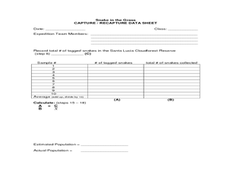
Snake in the Grass: Capture/Recapture Activity
Learners estimate the total number of species in Ecuador using the capture/recapture method. They collect data about each species and act as members of a science expedition to determine the total number of species by using mathematical...
Mathed Up!
Distance Time Graphs
If only there was a graph to show the distance traveled over a period of time. Given distance-time graphs, pupils read them to determine the answers to questions. Using the distance and time on a straight line, scholars calculate the...
GLOBE Program
Calculating Relative Air Mass
Combine math and science with fun in the sun! Scientists build a solar gnomon using reusable materials to calculate relative air mass. Mathematicians measure the pole's shadow and use the data to solve for relative air mass....
Curated OER
Surface Area and Volume
In this comprehensive instructional activity, young geometers solve a number of surface area and volume problems. Problems range from basic formula-based calculations to more challenging geometric figures and word problems.
Curated OER
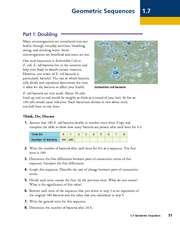
Geometric Sequences - Bacterial Growth
Bring algebra to life with scientific applications. Math minded individuals calculate and graph the time it takes a bacterium to double. They discuss geometric sequences and use a chart to graph their findings. There are 38 questions all...
Curated OER
Hot Chocolate Problems
Kids love real word math becuase it connects to their everyday life and is really useful to learn. They are given the recipe for hot chocolate, using that recipe they must alter the quantities of each ingredient in order to accommodate a...
Bowland
You Reckon?
Sometimes simple is just better. A set of activities teaches young mathematicians about using plausible estimation to solve problems. They break problems down to simpler problems, use rounding and estimation strategies, and consider...
Curated OER
Exploring Renewable Energy Through Graphs and Statistics
Ninth graders identify different sources of renewable and nonrenewable energy. In this math lesson, learners calculate their own carbon footprint based on the carbon dioxide they create daily. They use statistics to analyze data on power...
Geometry Accelerated
Coordinate Geometry Additional Practice
Your learners get extra practice using coordinates in calculating mid points, finding end points, deciding if points are collinear, calculations using slope concepts, writing linear equations, using triangles and quadrilaterals, and...
CK-12 Foundation
Displaying Categorical Variables: Spending Habits
Bar or circle graph—which is best? Given a circle graph and a total amount of money earned, pupils calculate the amount of money in each category. Learners use the calculated amounts to create a bar graph and compare the two displays.
Education Institute
Four Mathematics Lessons for Grade 9
These four lesson plans build algebra skills for working with numbers in exponential form and for examining triangles. Be aware that in the text, scientific notation is referred to as index notation and the laws of exponents as the laws...
K-5 Math Teaching Resources
Elapsed Time Ruler Sample 1 x 4 Rulers
Who knew that you could measure time with a ruler? This great printable resource allows young mathematicians to visualize the hours of the day as they learn to calculate elapsed time.
101 Questions
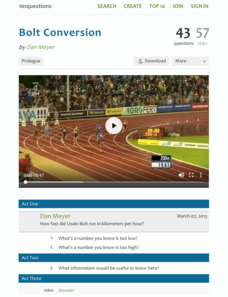
Bolt Conversion
Usain Bolt and Superman have something in common—speed! A video of one of Bolt's races introduces young scholars to the concept of unit rate. Using data from the race, the narrator calculates a unit rate in kilometers per hour, which...
Concord Consortium
Heights and Weights
Height is dependent on weight—or is it the other way around? Given data from a physicians handbook, individuals compare the height and weight of males and females at different areas. They calculate differences and ratios to assist with...
Corbett Maths
The Range
Spread the data out on the range. The short video provides a definition of the range. Using a data set of five numbers, the resource calculates the range.
Curated OER
Dividing Larger Numbers
As math scholars begin taking on more complex division problems, it's time to cover the different ways to show remainders. Here, they complete eight long-division equations with a fraction remainder and then eight more with a unit...
Illustrative Mathematics
But Mango Is My Favorite...
Opening up a package of fruit snacks is like a box of chocolates, you never know what you're going to get. When all the mango flavored ones are missing, learners calculate the probability that one bag versus the whole box is missing the...
101 Questions
Neptune
Examine an innovative approach to a large-scale model. Pupils across the state of Maine teamed up to create a model of the solar system that spans 40 miles. Put thinking skills to work within your classes as they make the calculations to...
Balanced Assessment
Cost of Living
Math scholars investigate the cost of living in Hong Kong compared to Chicago but must first convert the different types of currency. They then choose a type of graph to compare different spending categories and finish the activity by...
101 Questions
Brita
It's hard to envision what 39 billion plastic bottles look like. Brita claims that the US uses that number of plastic bottles each year! If that's not enough to get your attention, figure out how many times 39 billion water bottles can...
EngageNY
Why Do Banks Pay YOU to Provide Their Services?
How does a bank make money? That is the question at the based of a instructional activity that explores the methods banks use to calculate interest. Groups compare the linear simple interest pattern with the exponential compound interest...
Flipped Math
Calculus AB/BC - Approximating Areas with Riemann Sums
There are several ways to estimate the area if the curve does not create nice geometric figures. The presenter introduces the idea of using areas of rectangles to estimate the area under the curve. Pupils use four types of Riemann Sums,...
Laying the Foundation
Box-and-Whisker Plots
Statistics is made approachable, and dare we say fun, in this activity on using box-and-whisker plots to analyze and compare data sets. Specific emphasis is placed on interpretations and explanations while graphing, and in using the...
Willow Tree
Simple Probability
The probability of learning from this lesson is high! Learners calculate probabilities as numbers and as decimals. They see how to use a complement to find a probability and even try a simple geometric probability problem.


