Curated OER
Probably Passage (Predicting)
Third graders practice predicting. In this prediction lesson, 3rd graders read a worksheet and they predict where 15 words will fit into the story. After they read the story, they discuss the similarities and differences between their...
EngageNY
Determining the Equation of a Line Fit to Data
What makes a good best-fit line? In the 10th part of a 16-part module, scholars learn how to analyze trend lines to choose the best fit, and to write equations for best-fit lines to make predictions.
Chicago Botanic Garden
Recognizing Change (Observation vs. Inference)
What is the difference between making inferences and making observations? Young climatologists refer to a PowerPoint to make observations on each slide. They record their observations in a provided worksheet before drawing a...
EngageNY
Modeling a Context from Data (part 2)
Forgive me, I regress. Building upon previous modeling activities, the class examines models using the regression function on a graphing calculator. They use the modeling process to interpret the context and to make predictions...
EngageNY
Analyzing Residuals (Part 2)
Learn about patterns in residual plots with an informative math lesson. Two examples make connections between the appearance of a residual plot and whether a linear model is the best model apparent. The problem set and exit ticket...
101 Questions
Snow Day
Who doesn't like a snow day? Learners watch a snow accumulation over a span of 10 hours. They use that information to make a prediction of the total snow that fell during the 23-hour snowfall. Will it be enough to cancel school?
Curated OER
Investigating the Climate System - Clouds
Here is a fabulous lesson on the Earth's radiant energy system. This amazing, 31-page document is chock-full of great activities, worksheets, lab sheets, quizzes, rubrics, and assessments. Learners model and explain cloud formation,...
Curated OER
Clouds and the Earth's Radiant Energy System
Wow! What a lesson plan! Six terrific activities are described in great detail, in this 31-page document! Learners will model and explain cloud formation, sketch and identify certain cloud types, calculate and compare incoming and...
Curated OER
How Probable is It?
Students explore probability. In this probability lesson, students look at videos and websites where they discover probability facts that can be used in situations. They determine the probability of different events.
EngageNY
Mid-Module Assessment Task - Algebra 2 (Module 1)
Challenge classes to think deeply and apply their understanding of polynomials. The assessment prompts learners to use polynomial functions to model different situations and use them to make predictions and conclusions.
EngageNY
Modeling from a Sequence
Building upon previous knowledge of sequences, collaborative pairs analyze sequences to determine the type and to make predictions of future terms. The exercises build through arithmetic and geometric sequences before introducing...
EngageNY
Modeling an Invasive Species Population
Context makes everything better! Groups use real data to create models and make predictions. Classmates compare an exponential model to a linear model, then consider the real-life implications.
EngageNY
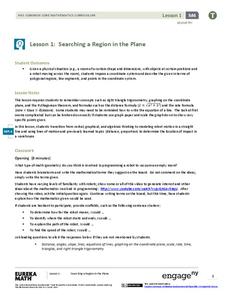
Searching a Region in the Plane
Programming a robot is a mathematical task! The activity asks learners to examine the process of programming a robot to vacuum a room. They use a coordinate plane to model the room, write equations to represent movement, determine the...
EngageNY
Modeling with Quadratic Functions (part 1)
Relevance is key! The resource applies quadratic modeling by incorporating application of physics and business. Pupils work through scenarios of projectile motion and revenue/profit relationships. By using the key features of the graph,...
EngageNY
Calculating Conditional Probabilities and Evaluating Independence Using Two-Way Tables (part 1)
Being a statistician means never having to say you're certain! Learners develop two-way frequency tables and calculate conditional and independent probabilities. They understand probability as a method of making a prediction.
EngageNY
Linear and Exponential Models—Comparing Growth Rates
Does a linear or exponential model fit the data better? Guide your class through an exploration to answer this question. Pupils create an exponential and linear model for a data set and draw conclusions, based on predictions and the...
Willow Tree
Approximating a Line of Best Fit
You may be able to see patterns visually, but mathematics quantifies them. Here learners find correlation in scatterplots and write equations to represent that relationship. They fit a line to the data, find two points on the line, and...
Project Maths
Introduction to Patterns
The world is full of patterns. Help learners quantify those patterns with mathematical representations. The first Algebra lesson in a compilation of four uses a series of activities to build the concept of patterns using multiple...
Curated OER
Shape Tool
Learners explore various polygons and examine how shapes can be manipulated in a variety of ways. In this shape tool lesson, students identify geometric shapes in two dimensions. Learners identify and draw one line of symmetry in a...
Curated OER
Ohio Census 1990 & 2000
Students use Ohio census data to solve problems, make comparisons, draw conclusions, and support predictions related to Ohio's population. They interpret and work with pictures, numbers and symbolic information.
Curated OER
Chances Are: Talking Probability
Young scholars explore probability and the process of data analysis and predictions. They participate in two activities, one involving a calculator and one the Internet, in which they make predictions and conduct activities to test...
Curated OER
Track's Slippery Slope
Students graph data of sports figure running time using x-axis y-axis to find slope of trend line, mathematically find the interpolated and extrapolated values for data points. Using the information they make predictions.
PHET
My Solar System
Orbit diagrams appear to be a work of mathematical art. The simulation helps scholars build their own systems of planets, stars, moons, etc., to observe their orbits. By altering their positions, velocities, and masses, a variety of...
Curated OER
How Long Can You Go?
Eighth graders examine the usefulness of a line of best fit by collecting and graphing data, using a graphing calculator to determine the line of best fit, and making a variety of predictions. They watch a video, then design a...


