Curated OER
Science: Draining the Land - the Mississippi River
Students use topographic maps to identify parts of rivers. In addition, they discover gradient and predict changes in the channels caused by variations in water flow. Other activities include sketching a river model with a new channel...
PBS
Reading Adventure Pack: Rivers
A Reading Adventure Pack showcases a fiction and nonfiction book followed by a series of hands-on activities. First, learners widdle sticks to build a tiny raft, conduct sensory experiments, and create a rap or folk song about rivers and...
Curated OER
Pascagoula River Basin 9th Grade Mississippi Studies
Ninth graders examine pressures on the Pascagoula River and the danger that Mississippi may lose a natural treasure before residents grasp its value and appreciate the potential for long-term benefit.
Curated OER
Rivers, Maps, and Math
Students use maps to locate and label the major rivers of North and South America. Using the internet, they identify forests, grasslands, mountain ranges and other landforms on the continents as well. They compare and contrast the...
Curated OER
Be a Watershed - Create a Living River
Students investigate water ways by conducting an experiment with classmates. In this natural resources instructional activity, students define a watershed and identify where large ones are located within the United States. ...
Curated OER
Cane River Civil Rights: A Native American Perspective
Students interpret historical evidence presented in primary resources. In this civil rights lesson, students examine the civil rights struggle from a Native American perspective. Students analyze documents and write journal entries that...
Curated OER
Surface Water
In this surface water worksheet, students review water runoff, drainage basins, and river erosion. This worksheet has 7 multiple choice and 3 fill in the blank questions.
Curated OER
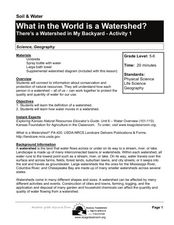
What in the World Is a Watershed?
Learners discover the role of a watershed. In this geography lesson, students are shown a diagram of a watershed and discuss the definition of a watershed. Learners demonstrate the role of a watershed by using an umbrella and spraying it...
Curated OER
Atlatl Lessons Grades 4-12: Lesson for Beginning Users of Atlatl
Sixth graders determine the mean, range median and mode of a set of numbers and display them. In this data lesson students form a set of data and use computer spreadsheet to display the information. They extend of the process by...
Curated OER
Lessons for Atlatl Users with Some Experience-Grade 6
Sixth graders experiment with an atlatl and dart. In this sixth grade data management mathematics lesson, 6th graders explore and determine the most suitable methods of displaying data collected from their experimentation with...
Curated OER
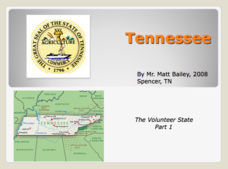
Tennessee: The Volunteer State Part 1
Explore the state of Tennessee, PowerPoint style! Regions, geographical features, and some amazing state facts are yours for the asking. Major cities are named and followed by related facts. This neat presentation on an interesting state...
Curated OER
Bats Migrate South
Students examine the life of bats in Illinois. Using the internet, they research the history of the bat in Illinois and describe the way they find prey by using echolocation. They report their findings to the class and answer any...
Curated OER
Exploration Watershed
Students discuss what a watershed is, and locate watersheds on a map. In this watershed lesson, students use the information they have been introduced to and create a color coded watershed map of their own.
Curated OER
Surface Water Model
Learners examine, through demonstration and experimentation, how water moves through watershed, identify pollutants that can enter water system from different land use activities, and discuss ways people can help prevent water pollution.
Curated OER
The Mussels Are Coming
Learners work together to identify and describe the various types of mussels. Using a color-coded system, they plot the arrival date of zebra mussels in North American waters. They discuss the increase in their population with the class.
Curated OER
Arkansas Water Resources
Third graders examine Arkansas's major water resources. They discuss the difference between man-made and natural resources and what the resources are used for.
Curated OER
Geography of the United States
Students examine the population growth of the United States. In this Geography lesson, students construct a map of the fifty states. Students create a graph of the population of the USA.
Curated OER
What's a Swamp Good For?
Learners identify the function and value of wetlands. In this lesson on appreciating wetlands, students explain how different household items can represent different aspects of the wetlands.
Curated OER
Beyond the Tap
Students explain the basic properties of a watershed including how water flows from higher to lower elevations and how watersheds are interconnected. They comprehend how the placement of buildings, roads, and parking lots can be...
Curated OER
Educational Technology Clearinghouse: Maps Etc: Illinois River System, 1916
A map from 1916 of the Illinois River drainage basin showing the primary and secondary tributaries from Lake Michigan to the Mississippi River.
Curated OER
Mountains, Plains, Rivers, Isothermal Lines of the United States, 1873
A map from 1873 of the United States showing the physical features of mountain systems, plateaus, basins, plains, rivers, lakes, and coastal features, with elevations given for prominent peaks given in feet above sea level. The map is...
Curated OER
Portrait: Cavelier De La Salle
Rene Robert Cavelier, Sieur de La Salle (1643 - 1687) was a French explorer. He explored the Great Lakes region of the United States and Canada, the Mississippi River, and the Gulf of Mexico. La Salle claimed the entire Mississippi basin...
Curated OER
Educational Technology Clearinghouse: Maps Etc: North America, 1901
A map from 1901 of North America, Central America, the Caribbean, and Greenland showing general land elevations, mountain systems, rivers, coastal features, and ocean currents. The map is color-coded to show land elevations ranging from...
Curated OER
Educational Technology Clearinghouse: Maps Etc: South American Rainfall, 1901
A map from 1901 showing mean annual rainfall in South America. The map shows the equatorial rain belt in July and in January, the direction of prevailing winds and their effect on rainfall patterns. The map shows regions ranging from...


