Curated OER
Human Population Growth
In this human population growth activity, students create a graph of human population growth and predict future growth using the data given in a chart. Students identify factors that affect population growth.
Curated OER
Areas Under Curves: An Astronomical Perspective
In this area under the curve activity, students use a graph of the number of exoplanets discovered and the year they were discovered to solve 5 problems. Students find the total area under the curve, they find the total number of planets...
Curated OER
Fire Safety Survey
Students collect data regarding fire safety and create a graph. Working in small groups, they administer a survey to family and friends regarding their attitudes toward fire safety. After data has been gathered, students graph their...
Curated OER
What is an Average?
In this averages learning exercise, students practice finding the averages of numbers. They use a chart with data to find the average number of wildfires in four states between 1993 and 1996.
Curated OER
Earthquake Power
In this earthquakes instructional activity, students learn about the measurements of earthquakes on the Richter scale. They answer six questions about the magnitudes and sizes of earthquakes using two tables of data about earthquakes and...
Curated OER
Chalkboard Challenge: 5th Grade Math Review
This math review PowerPoint engages fifth grade students in an interactive review of math concepts. This review game includes questions on numeration, data interpretation and number theory. This is in a "Jeopardy" style format.
Curated OER
Development of Federal Civil Rights Acts : 1950's - Present
Students use the Internet to research one of five cases associated with Brown v. Board of Education and then join a group with people who researched the other four.
Curated OER
Hands On: Model Finding the Mean
In this data activity, 5th graders use counters to model finding the mean in 6 word problems. They work with 6 sets of numbers which include fractions.
Theodore Roosevelt Association
Theodore Roosevelt: A Presidential Timeline
Throughout his life and presidency, Theodore Roosevelt contributed to the America we know today in so many ways. An adaptable activity prompts young historians to create a chronological timeline of Roosevelt's contributions to different...
Curated OER
The Correlation Between Human Population Growth and Dwindling Natural Resources
Eighth graders predict human population growth. In this lesson, 8th graders discuss the length of time needed to double the human population, work in groups to chart population growth and predict population growth in the...
Curated OER
Using Basic Properties to Solve Problems in Math
Learners identify and define the rules of properties of real numbers. They rewrite each of the problems listed using the commutative or associative properties. Pupils apply problem solving strategies to clarify situations in a table...
Noyce Foundation
Ducklings
The class gets their mean and median all in a row with an assessment task that uses a population of ducklings to work with data displays and measures of central tendency. Pupils create a frequency chart and calculate the mean and median....
Curated OER
Range and Mode
In this data interpretation worksheet, 2nd graders review the definitions of range and mode. They use the information from a data table to answer 5 questions about the children in after-school clubs.
Curated OER
Discovering Growth Patterns
In this statistics worksheet, learners examine data on a variety of subjects related to growth patterns and apply the data to 4 different graphs.
Curated OER
Millions, Billions, Trillions
Pupils use real-world data to compare the relative sizes of millions and billions, and exponential growth. They use the salaries of famous people such as, Michael Jordan and Bill Gates to understand this math concept.
Curated OER
Science: Coral Reef Food Pyramid
Students construct numbers pyramids using fictional data from a coral reef. they tally the numbers of carnivores, herbivores, and producers. Students next build a pyramid shape in which they put their numbers of producers, herbivores,...
Curated OER
Annotated Example of Socratic Questioning: Climate: Global Warming
Students compare and discuss short-term and longer-term global temperature data. They evaluate data from three sets of graphs and then participate in a structured whole class Socratic discussion on the possible causes of climate change.
Computer Science Unplugged
Card Flip Magic—Error Detection and Correction
I can find the error in an array of cards? After watching a demonstration class members search for the error is the provided cards. The resource provides a real-life example of using ISBN numbers in error detection and using check sums.
Curated OER
Mean, Median, and Mode
Young scholars calculate measures of central tendency. in this mean, median, and mode lesson, students calculate the measures of central tendency. They organize data, examine and explain the statistics.
Math Drills
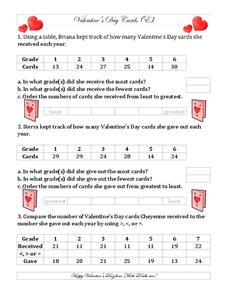
Valentine's Day Ordering and Comparing (E)
Love is in the air, and in a math table! Young learners chart the number of cards from each grade from least to greatest in three Valentine's Day word problems.
Curated OER
Census Statistics and Graphing
Pupils graphically represent data from the Census. In this middle school mathematics lesson, students investigate the housing characteristics of different tribes of Native Americans and compare them to the average American population. ...
Curated OER
Cute Calves of Just Tasty Steaks
Students examine the state of agriculture. In this animal husbandry lesson, students visit selected Web sites to research data on people's changing diets, farming practices, and animal health care.
Inside Mathematics
Party
Thirty at the party won't cost any more than twenty-five. The assessment task provides a scenario for the cost of a party where the initial fee covers a given number of guests. The class determines the cost for specific numbers of guests...
PBS
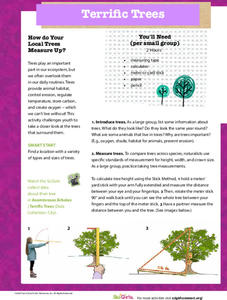
Terrific Trees
Engage in a shady activity to practice measurement techniques. Classes venture outside to collect measurements of various trees, using different strategies to measure the height, trunk circumference, width, and crown size. Then they...


