Curated OER
Pictograms: Animals in the Zoo
In this math worksheet, students examine a pictogram which shows data about how many of 5 species of animals live in the zoo. Students answer 7 word problems about the pictogram.
Curated OER
Numeracy Practice Math Sports
In this math worksheet, students match the pictographs to find the quantities and write each number sentence. They use the operation of addition.
Curated OER
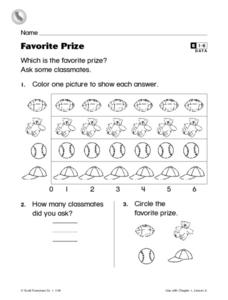
Favorite Prize
In this graphing worksheet, students focus on the usage of a pictograph. Students poll classmates and respond to 2 questions about the graph that they have created.
Curated OER
You Need How Much Food When? Where?
Ninth graders explore how human activities shape the earth's surface. In this awareness lesson, 9th graders create pictographs showing the relations of food, people, land, and resources. Students complete worksheet.
Curated OER
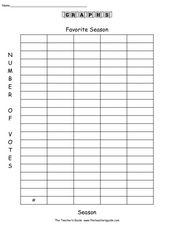
Favorite Season
In this graphing worksheet, students conduct a survey of people's favorite survey. They then complete 8 questions about the data gathered before creating a bar graph and pictograph on templates.
Curated OER
Weather Observation Journal
Students record weather for a period of one month. In this weather lesson, students observe weather for one month on a large pictograph. Students record clouds, wind, temperature and any other weather conditions they observe. Students...
Curated OER
Pick a Pet
Students construct a pictograph of favorite pets. In this pets and graphing lesson, students discuss their favorite pet and use animal magazines to find their favorite pets and cut them out. Students create a pictograph using the pictures.
Curated OER
How Many People Live in Your Household?
Students create a pictograph showing household size for the class.In this data collection and graphing lesson, the teacher guides students through the creation of a concrete object graph, then students analyze and summarize the results.
Curated OER
Graphing
Intended for a faith-based classroom, this lesson requires second graders to create a survey, conduct the survey in multiple classrooms, and graph the results. They can choose between creating a picture or bar graph, or you can require...
Curated OER
Comparing School Bus Stats
Engage in a lesson that is about the use of statistics to examine the number of school buses used in particular states. They perform the research and record the data on the appropriate type of graph. Then they solve related word problems.
Curated OER
Connecting With Coordinates
Play a coordinates game to encourage collaborative learning and grid use! Learners plot points on grids and play a game that challenges them to locate a specific point on a coordinate grid by using horizontal and vertical movements.
Curated OER
Can You Count on Cans?
How can a canned food drive be connected to math? It's as simple as counting and organizing the cans! Children demonstrate their ability to sort non-perishable foods into categories that include soup cans, vegetable cans, boxed items,...
Curated OER
Hollywood's Top Ten
Students gather data on top 10 highest grossing movies, and make a bar graph and a pictogram.
Alabama Learning Exchange
Tiger Math Graphing
Learners practice various skills using the book Tiger Math: Learning to Graph from a Baby Tiger. After listening to the story, they create a pictograph using data collected from the text. They also color a picture of a tiger, collect...
National Security Agency
Line Plots: Frogs in Flight
Have a hopping good time teaching your class how to collect and graph data with this fun activity-based instructional activity series. Using the provided data taken from a frog jumping contest, children first work together creating a...
Curated OER
Math: Graphs and Their Symbols
Second graders examine different types of graphs and discover the meanings of the symbols used on them. After gathering data about themselves, their communities, and the world, they use that information to create graphs. Among the...
Curated OER
Rockin? Chalk (Integrating science - make own chalk)
Students use plaster of Paris, talc, and cornstarch to create their own chalk. They hypothesize what mixture of ingredients produce the "best" chalk. Students discuss what they think are the characteristics of the "best" chalk.
Curated OER
Fruit Loop Graphing
Fifth graders interpret data and create graphs. Given Fruit Loops, they sort and classify according to color. Using spreadsheet technology, 5th graders record their data and create bar and circle graphs. Students analyze data and...
Curated OER
Usage and Interpretation of Graphs
Students explore graphing. In this graphing lesson, students predict how many shoe eyelets are present in the classroom. Students count eyelets and work in groups to organize and chart the data collected. Students put all the data...
Curated OER
Pictograms
Have your class practice using a pictogram with this resource. Learners count tally marks, and answer a few questions related to the graph. Afterwards, they could create their own pictograms.
Curated OER
Poetry/Music: Let It Snow!
Young scholars create poems and sound compositions using instruments, sounds, and pictograph notation. After listening Debussy's Children's corner suite, they brainstorm a list of snow vocabulary words. Students write poems and in groups...
Curated OER
School Activities
First graders place some specific types of objects (e.g., shoes, favorite food) on concrete graphs and pictographs. They listen and respond to others in a variety of contexts (e.g., pay attention to the speaker; take turns speaking in a...
Curated OER
Moo-Velous Butter!
Third graders investigate how temperature and motion (energy) create a chemical change that turns cream ( a liquid) into butter (a solid). They create a class pictograph of their favorite mils choices (white, chocolate, or strawberry)...
Curated OER
Stone Soup
Students examine the topics of conflict, resolution, and solution using the book "Stone Soup." They create a class pictograph using real vegetables brought in by the students, answer story comprehension questions, and sequence the events...
Other popular searches
- Bar Graphs Pictographs
- Pictographs and Bar Graphs
- Tally Charts and Pictographs
- Tally Charts or Pictographs.
- Math Pictographs
- Iroquois Indians Pictographs
- Interpreting Pictographs
- Native American Pictographs
- Sioux Indians Pictographs
- Reading Pictographs
- Math, Pictographs
- Math Lessons Pictographs


