Curated OER
Let the Rain Come Down!
Second graders construct a bar graph comparing local precipitation to that of the Yucatan. In this graphing instructional activity, 2nd graders will use conversions and problem solving strategies.
Curated OER
Getting to Know You
Students converse with each other while playing a game in order to discover things that are alike and things that are different about themselves. The students gather data about themselves, organize and display data on the graph, and...
Curated OER
Why do people mover where they do?
Young scholars read factual stories of migration to Hawaii, analyze and explain push and pull factors, interview parents about their cultural heritage, identify countried of origin of their ancestors, graph migration patterns on an world...
Curated OER
"Mr. Betts and Mr. Potts"
First graders listen to the book "Mr. Betts and Mr. Potts" and examine the career of being a veterinarian. They categorize animals based on whether they could be house pets or not, develop a class pet graph, and list the various...
Curated OER
Read Aloud: "The Bookshop Dog"
Students listen to the book "The Bookshop Dog" and discuss what happens when there is a change in their lives. They create a class T-chart about changes and feelings, develop a graph related to the story, and define key story vocabulary...
Curated OER
Graphing To Solve Systems of Equations
Young scholars explore graping linear equations and their relevance to real life situations. After a teacher led demonstration, students work at their desks and on the board to plot points and determine the slope of a line. Young...
Curated OER
Savanna Animals
In this Savanna animals worksheet, students color a picture of an ostrich and complete a blank graph underneath it. Students color 1 picture and complete 1 graph.
Curated OER
Tallying Animals
Second graders draw a picture of a pond scene which includes various animals. They exchange pictures and tally the number of animals drawn. Then they record the number on a chart and write a story about their pictures.
Curated OER
Parabola with Horizontal Directrix
Young scholars find the vertex, directrix, and focus of a parabola. They graph parabolic functions and solve application problems involving parabalas.
Curated OER
Parabola With Horizontal Directrix
Students find the vertex, directrix, and focus of a parabola and graph parabolic functions. They solve problems involving parabolas after a demonstration lesson by the teacher.
Curated OER
Counting Squares
For this counting squares worksheet, students solve 2 problems that include counting 2 different sets of squares. First, they draw a picture of four squares arranged in two rows of two. Then, students determine the total number of...
Curated OER
Voting and Elections: Vote to Make a Difference
Students use a ballot to make a choice about two items to vote on. In this voting lesson plan, students discuss comparing choices between two items, the benefits and drawbacks to each, and make tally marks to total the votes.
Curated OER
Maps and Modes, Finding a Mean Home on the Range
Fifth graders investigate data from maps to solve problems. In this data lesson, 5th graders study maps and collect data from each map. Students present their data in a variety of ways and calculate the mode, mean, median, and range.
Curated OER
Organizing and Understanding Data - Independent Practice
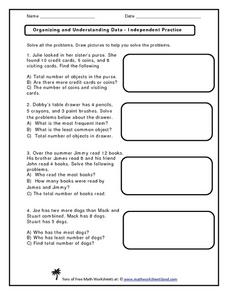
Provide your first graders with an opportunity for independent practice organizing and understanding data. The ten story prompts on this three-page worksheet asks learners to solve problems involving concepts of the total number of...
Curated OER
Triangles Inscribed in a Circle
Are you tired of answers without understanding? Learners can give a correct response, but do they really understand the concept? Have young mathematicians think deeper about linear functions, angles, and formulas in algebra. Learners are...
World Wildlife Fund
Land of the Midnight Sun
From days of 24 hour sunlight, to endless nights that last for days, the Arctic is a very unique place to live. Examine the seasonal changes that occur in the northern-most reaches of the globe and the impact they have on the plants and...
California Education Partners
T Shirts
Which deal is best? Learners determine which of two companies has the best deal for a particular number of shirts. They begin by creating a table and equations containing each company's pricing structure. Individuals finish the seventh...
Redefining Progress
Have and Have-Not
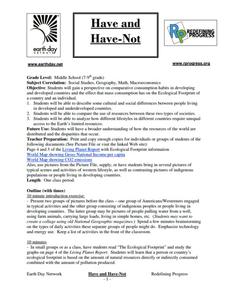
Is there a correlation between a country's wealth and the extent of its ecological footprint? What exactly constitutes an ecological footprint, and how does one country stack up against the rest? This is a unique instructional activity...
Florida Center for Reading Research
Phonological Awareness: Syllables, Syllable Say
Counting syllables can be fun when it's done with a friend. In pairs, learners say words as their partner counts the syllables they hear.
Virginia Department of Education
Adaptation and Evolution
Um may be the atomic symbol for confusion, but it won't be needed in this lesson. Scholars rotate through seven stations completing experiments, hands-on activities, writing exercises, and analysis. Stations include material on...
Science Matters
Richter Scale
The 12th lesson in a series of 20 opens with a demonstration of exponential functions using pasta. This concept is connected to the Richter Scale, which is also an exponential function. Scholars compare the exponential scale that...
EngageNY
Why Are Vectors Useful? 2
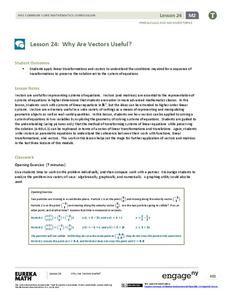
Investigate the application of vector transformations applied to linear systems. Individuals use vectors to transform a linear system translating the solution to the origin. They apply their understanding of vectors, matrices,...
Concord Consortium
Line of Sight
There's no way around it—learners must use trigonometry to model the line of sight around a race track! Using the starting line as the origin, pupils model the straight line distance to any car using a trigonometric expression. The...
Super Duper Publications
WH Question Cards - Pro: Who, What, When, Where, Why
Do you have kids on your caseload with wh questions goals, that need extra practice comprehending and asking who, what, when, where, and why questions? Then this clever app is designed for you!
Other popular searches
- Coordinate Picture Graphs
- Christmas Picture Graphs
- M&m Picture Graphs
- Hidden Picture Math Graphs
- Picture Graphs Worksheets
- Math Lessons Picture Graphs
- 5th Grade Picture Graphs
- Bar and Picture Graphs
- Thanksgiving Picture Graphs
- Circle and Picture Graphs
- Picture Graphs Template
- Reading Picture Graphs


