Illustrative Mathematics
Walk-a-thon 2
During a walk-a-thon your learners must determine the walking rate of Julianna's progress. Using tables, graphs, and an equation, they must be able to calculate the time it took her to walk one mile and predict her distance based on the...
EngageNY
Motion Along a Line – Search Robots Again
We can mathematically model the path of a robot. Learners use parametric equations to find the location of a robot at a given time. They compare the paths of multiple robots looking for parallel and perpendicular relationships and...
Inside Mathematics
Graphs (2006)
When told to describe a line, do your pupils list its color, length, and which side is high or low? Use a worksheet that engages scholars to properly label line graphs. It then requests two applied reasoning answers.
Curated OER
Slope-Intercept Form of a Line
Using the subscriber website Explorelearning.com, young mathematicians observe changes in the slope and y-intercept and their effect on the graph of lines. This activity helps students develop an intuitive sense of the connection between...
Curated OER
Barbie Bungee
Middle and high schoolers collect and analyze their data. In this statistics lesson, pupils analyze graphs for linear regression as they discuss the relationship of the function to the number of rubber bands and the distance of the...
Teach Engineering
Can You Resist This?
Some things are hard to resist. Small collaborative groups build circuits and calculate the voltage using Ohm's Law. Budding engineers explore the connection between the voltage across different resistors and linear functions with...
Bytes Arithmetic
Geometry Pad+
Graphing paper, pencil, ruler, protractor, and compass, all get replaced or supplemented with this dynamic geometry application. Here, you can create, move, and scale many different shapes, as well as, explore and change their properties...
Curated OER
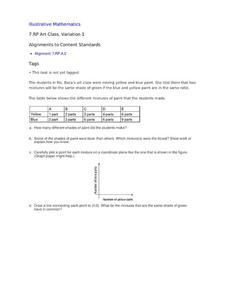
Art Class, Variation 1
Student statisticians calculate ratios to determine how many shades of green were mixed by Ms. Baca's art class. They graph the number of blue parts against the number of yellow parts for each combination and discover that some produce...
Balanced Assessment
Para-Ball-A
Analyze the flight of a thrown ball. Learners determine the maximum height of a thrown ball and the time it takes to hit the ground given its initial speed. They continue to review different scenarios with different maximums or different...
EngageNY
Graphs of Simple Nonlinear Functions
Time to move on to nonlinear functions. Scholars create input/output tables and use these to graph simple nonlinear functions. They calculate rates of change to distinguish between linear and nonlinear functions.
Virginia Department of Education
Graphing Linear Equations
Combine linear equations and a little creativity to produce a work of art. Math scholars create a design as they graph a list of linear equations. Their project results in a stained glass window pattern that they color.
Curated OER
Relating Algebra to Geometry
Learners investigate the connection that exists between Algebra and Geometry. They classify two and three-dimensional figures. Pupils use formulas to solve problems in geometry and use appropriate measuring devices in the right contexts.
Pennsylvania Department of Education
The Multiplicative Identity and Numbers Close to One
Pupils practice multiplying and dividing whole numbers by fractions. They study the multiplicative identity property that states that the product of any number and 1 is that number. They multiply whole numbers by fractions close to 1 and...
Curated OER
Am I Straight
Identify the slope of a linear equation in this algebra lesson. Middle schoolers graph linear equations using slopes and intercepts. They identify the slope as being positive, negative, no slope, or undefined.
Curated OER
Graphs and Functions
Use this series of activities to introduce learners to graphing functions. They graph both linear and quadratic equations by hand and with a Graph Sketcher Tool. Several imbedded links and handouts are included in the lesson.
Curated OER
The Trapping of Trapezoids
This is a nice hands-on activity where young geometers create trapezoids and calculate their area by looking at areas of quadrilaterals and triangles.
Pennsylvania Department of Education
Fractional Parts Using an Area Model
Learners explore multiplying fractions and their relationship to parts of a whole. They draw and shade fractional parts to show parts of a whole and fractional parts of a fraction. Pupils also use an Internet site for interactive practice.
Curated OER
Dividing with Fractions
Use paper strips or models to relate division problems to division of fraction problems. Since the materials can be broken up, it helps them to show how they can complete repeated subtraction with fractions and not just whole numbers.
Curated OER
Discovering Ohm's Law
Connect math with science! Pupils apply properties of Ohms Law as they solve problems and identify the inverse relationship of a function. They analyze the shape of the graph of an inverse function and use it to make predictions.
Curated OER
Graphing Linear Equations with Two Variables
Can your class solve linear equations in two variables? They will be able to after they engage in this lesson. Individuals graph linear equations in two variables using slope and intercept and identifying the relationship between the x...
Curated OER
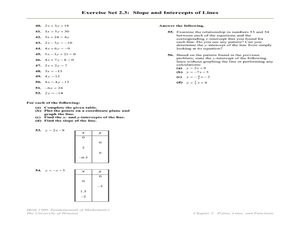
Slope, Intercepts, and Graphing a Line
In this intercepts and slope worksheet, students find the slope and/or the x and y-intercepts in fifty-three problems. Students also graph lines using the x and y-intercepts.
Curated OER
Building Sets of 13 and 14
Compose and decompose sets of 13 and 14 and compare sets of each with your little learners. They use objects to construct sets of 13 and 14, record their answers, and compare sets in several different ways.
Noyce Foundation
Snail Pace
Slow and steady wins the race? In the assessment task, scholars calculate the rates at which different snails travel in order to find the fastest snail. Hopefully, your class will move much more quickly in finishing the task!
Curated OER
Exponential Functions
In this algebra activity, students evaluate exponential functions using tables and graphs. There are 6 questions with an answer key.


