Cuemath
Cuemath: Frequency Distribution Table
A comprehensive guide for learning all about frequency distribution tables with definitions, how to create a frequency distribution table, and the formulas and graphs related to frequency distributions. With solved examples and...
Other
Web Quest: Take Me Out to the Ball Game
This is a WebQuest written by Susie Hallar of the Warrensburg Schools in Warrensburg, Missouri. Students research 10 famous baseball players, then use the information they find to compute averages, standard deviations, central...
University of Cambridge
University of Cambridge: Maths and Sports: David and Goliath
Does weight give shot putters an advantage? This activity encourages students to engage in statistical analysis, and is aimed at GCSE and A-level students (Key Stages 4 and 5).
Texas Instruments
Texas Instruments: Venn Diagrams
This set contains statistics questions about Venn diagrams. The student interprets when a Venn diagram suggests such event pairs as mutually exclusive, complementary, and independent events, and uses these diagrams in determining...
Stefan Warner and Steven R. Costenoble
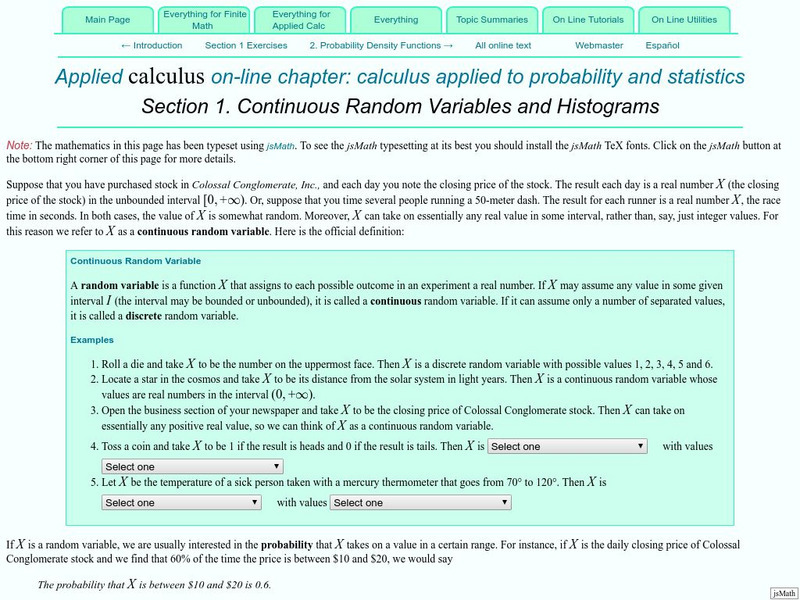
Finite Mathematics & Applied Calculus: Continuous Random Variables and Histograms
Students learn about random variables and histograms. Topics explored are continuous random variables, discrete random variables, probability, and frequency distributions. The tutorial investigtes the statistics concepts through class...
Other
Clayton State: Linear Regression
Introductory look at linear regression. Notes presented in outline form, with key concepts and formulas given. An example is presented at the end.
Texas A&M University
Wtamu Virtual Math Lab: Beginning Algebra: Reading Graphs
A good introduction to reading bar, line, and double line graphs, and drawing and reading Venn diagrams. Contains definitions and examples of these types of charts and graphs as well as practice exercises that ask you to answer questions...
Other
Hsor.org: Miguel Chooses a College: Tradeoffs
Use several strategies and criteria to help Miguel determine the college for him.
University of Cambridge
University of Cambridge: Maths and Sports: The Home Advantage
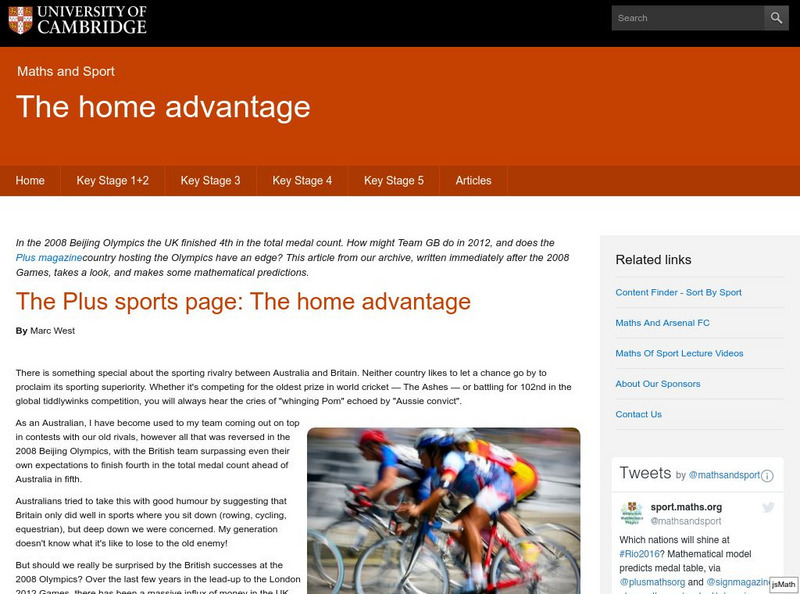
In the 2008 Beijing Olympics the UK finished 4th in the total medal count. How might we do in 2012, and does the country hosting the Olympics have an edge?
CK-12 Foundation
Ck 12: Algebra: Fitting Lines to Data
[Free Registration/Login may be required to access all resource tools.] Make a scatter plot of data and find the line of best fit to represent that data.
University of Cambridge
University of Cambridge: Maths and Sports: The Olympic Torch Tour
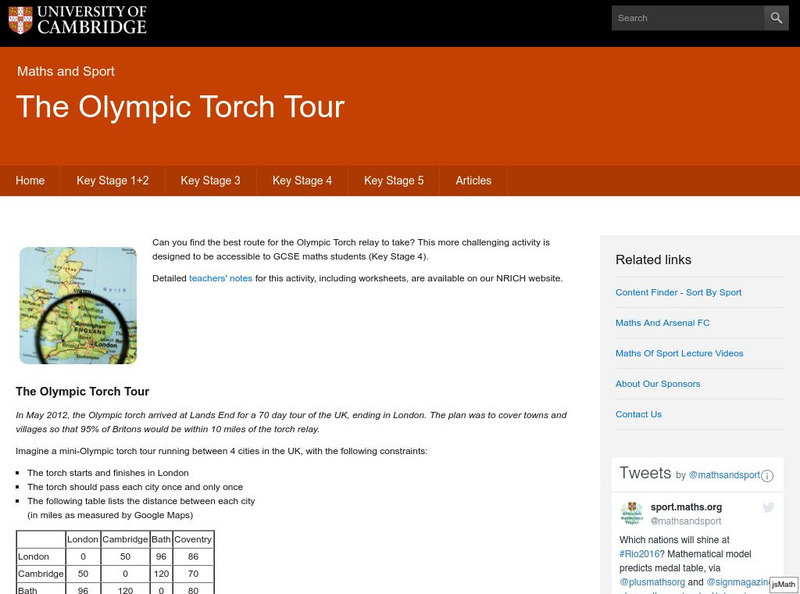
Can you find the best route for the Olympic Torch relay to take? This more challenging activity is designed to be accessible to GCSE maths students (grades 8, 9, and 10).
Texas Instruments
Texas Instruments: Heavy Hitting #2
This activity uses baseball's slugging average to compute weighted means using summary statistics. Some students may need an explanation of the terms singles, doubles, triples, and home runs.
Illustrative Mathematics
Illustrative Mathematics: S cp.a.4, S cp.a.5 and S cp.b.6: The Titanic 3
On April 15, 1912, the Titanic struck an iceberg and rapidly sank with only 710 of her 2,204 passengers and crew surviving. Some believe that the rescue procedures favored the wealthier first class passengers. Other believe that the...
Illustrative Mathematics
Illustrative Mathematics: S Id, F if Laptop Battery Charge
This task uses a situation that is familiar to learners to solve a problem they probably have all encountered before: How long will it take until an electronic device has a fully charged battery? Given data, students perform a variety of...
Stefan Warner and Steven R. Costenoble
Finite Mathematics & Applied Calculus: Bayes' Theorem and Applications
Students examine Bayes theorem. The tutorial investigates the statistics concept through class notes and examples. Review exercises and a chapter quiz are included.
Purple Math
Purplemath: Practical Algebra Lessons
Pre-Algebra and algebra lessons, from negative numbers through Pre-Calculus. Grouped by level of study. Lessons are practical in nature, informal in tone, and contain many worked examples and warnings about problem areas and probable...
CK-12 Foundation
Ck 12: Statistics: Independent Events and Sample Spaces Grades 9 10
[Free Registration/Login may be required to access all resource tools.] Covers the multiplication rule for independent events.
Alabama Learning Exchange
Alex: My Peanut Butter Is Better Than Yours!
The students will engage in the process of statistical data comparing data using tables and scatterplots. The students will compare data using measures of center (mean and median) and measures of spread (range). This lesson can be done...
Alabama Learning Exchange
Alex: Let's Make a Pie
The students will survey their classmates and construct circle graphs to display their results. Students will produce circle graphs using a compass and protractor, and then with an interactive computer program.This lesson plan was...
Alabama Learning Exchange
Alex: Box and Whisker With a Bed Sheet
The class will make a list of all of their classmates heights, ages in months, and shoe sizes. They will then use this data to create a human box-and-whisker plot. This lesson plan was created as a result of the Girls Engaged in Math and...
National Council of Teachers of Mathematics
Nctm: Illuminations: Advanced Data Grapher
The Advanced Data Grapher can be used to analyze data with box plots, bubble graphs, scatterplots, histograms, and stem-and-leaf plots.
Texas Instruments
Texas Instruments: Would You Like Fries With That?
French fries from your cafeteria to do data analysis. The students count the number of fries in a single serving of fries along with weighing the order, then measure the length and weight of a sample of individual fries. You then use the...
University of Cambridge
University of Cambridge: Maths and Sports: Archery
Use our interactivity to simulate picking up a bow and some arrows and trying to hit the target a few times. Can you work out the best settings for the sight? This activity gives an opportunity to gather and collate data, and to test...
University of Cambridge
University of Cambridge: Maths and Sports: What's the Point of Squash?
Squash isn't an Olympic sport (yet!) but it has an interesting scoring system. If you reach 8-all in a game of squash, when should you decide to play to 9 points rather than 10? This activity is a starting point for mathematical...


