Curated OER
Mystery Spinners
Take a spin with probability. Given a set of clues about the probability of events on a spinner, groups create their own device to match the clues. Using a jigsaw strategy, groups share their spinners and strategies with other groups....
Mathematics Assessment Project
Memory Game
Middle schoolers must determine probabilities for a memory game in which winning requires matching two of the same cards. They then must determine what happens when more cards are added to the pile.
CK-12 Foundation
Sums and Differences of Independent Random Variables: Traveling Seasickness
Use a Punnett square to calculate probabilities. The resource presents a situation in which two patients are randomly selected from a group of patients with a particular illness. Pupils use the interactive to determine the likelihood...
CK-12 Foundation
Normal Approximation of the Binomials Distribution: When to Approximate
Normalizing a binomial distribution — determine when it is all right. Given the rule of thumb of when it is appropriate to use the normal distribution to approximate a binomial distribution, pupils look at different scenarios. Scholars...
CK-12 Foundation
Expected Value: Game of Chance
Determine whether the payoff is worth it. Pupils calculate the expected value of a game with three different payoff levels. Each level has a different probability of winning money. The scholars find the expected payoffs for each level...
CK-12 Foundation
Operations with Sets: Let's Roll the Dice!
There's no need to roll dice for this probability experiment, the resource includes them already. Scholars use an interactive to see how including more possibilities as favorable outcomes in a dice activity affects the probabilities....
Corbett Maths
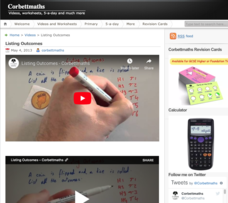
Listing Outcomes
Make a list and check it twice. Many times, it is beneficial to make a list of the possible outcomes when trying to determine a probability. The resource shows how to systematically make a list and then calculate the probability of...
Bowland
Lottery
Take a chance on raising money. Learners calculate probabilities to determine whether a lottery is a good way to raise money. Pupils determine the number of combinations of choosing two numbers between one and six. Using the sample...
Bowland
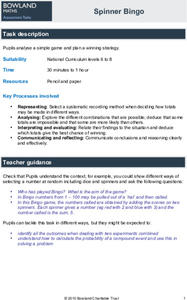
Spinner Bingo
Create a winning card. Given a description of a bingo game using two spinners, pupils determine which of three cards has the greatest chance of winning. Scholars then determine which are the best numbers to put on their own cards to give...
Curated OER
Mean, Median, Mode, etc.
Explore the concept of mean, median, and mode with pupils. They estimate the length of a string or the number of M&M's in a jar. Then find the mean, median, and mode of the class' estimates.
Pennsylvania Department of Education
What is the Chance?
Fourth and fifth graders make predictions using data. In this analyzing data lesson, pupils use experimental data, frequency tables, and line plots to look for patterns in the data in order to determine chance. You will need to make a...
Curated OER
Mathematical Treasure Hunt
The hunt is on! Young mathematicians follow clues and complete a series of ten math puzzles as they try to crack Dr. Integer's code and find the location of his hidden treasure.
Mathed Up!
Two Way Tables
When presented with categorical data, a two-way frequency table is a great way to summarize the information. Pupils organize categorical data using a two-way table, then use the tables to determine missing data and to calculate simple...
Noyce Foundation
Diminishing Return
Challenge individuals to compete as many tasks as possible. Lower-level tasks have pupils apply costs and rates to solve problems. Upper-level tasks add algebraic reasoning and conditional probability to the tasks.
CK-12 Foundation
Expected Value: Playing Darts
The expected payoff is right on target. An interactive resource provides a dart game scenario with amounts of cash prizes and probabilities of winning. Learners calculate the expected value and expected payoff for the game. To finish,...
Shodor Education Foundation
Overlapping Gaussians
Adjust the overlap to compare probabilities. Using sliders, learners adjust the shape of two Gaussian curves. The interactive calculates the area of the left tail for one curve and the right tail for the other. Pupils set the interactive...
Howard Hughes Medical Institute
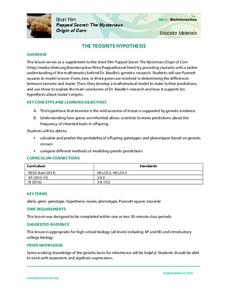
The Teosinte Hypothesis
Don't want to sound corny, but your class will be a-maize-d by an engaging activity! Explore the history of the modern corn plant through a video and Punnett squares. Junior genetics experts get hands-on experience with actual research...
College Board
2010 AP® Statistics Free-Response Questions Form B
Form a good familiarity with the AP® test using Form B of the 2010 AP® Statistics free-response questions. Pupils use a test from a previous administration to prepare for their exams. A set of six questions assesses box plots,...
College Board
2002 AP® Statistics Free-Response Questions Form B
Develop a deeper understanding of statistics. The six released free-response items from the 2002 AP® Statistics Form B involve several concepts that are currently in the regular statistics standards. Teachers see how AP® assessed the...
American Statistical Association
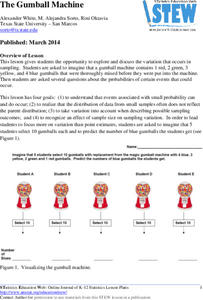
The Gumball Machine
Chew on an activity for probability. Given information on the number of gumballs in a gumball machine, scholars consider how likely it is to randomly draw a blue gumball and how many of each color they would draw in 10 trials if the...
Public Schools of North Carolina
Math Stars: A Problem-Solving Newsletter Grade 3
Make sure your class stays up with the times using this series of math newsletters. Including word problems that cover topics ranging from consumer math and symmetry to graphing and probability, these worksheets are a fun way to...
Mathed Up!
Frequency Polygons
Frequency polygons are a different way to represent frequencies over intervals. Pupils take frequencies for intervals of data from a frequency table and plot them as a frequency polygon. Budding mathematicians find information about the...
Beyond Benign
Can You Hear Me Now? Cell Phone Accounts
How sustainable are cell phones? Throughout the unit, learners explore the issues around cell phones concerning sustainability. Class members take a graphical look at the number of cell phones across the world using a box-and-whisker...
College Board
2009 AP® Statistics Free-Response Questions Form B
Is your class taking the AP® Statistics exam in the near future? You may want to take a look here. Using the 2009 AP® Statistics free-response questions Form B helps learners become familiar with the testing conditions, such as time...
Other popular searches
- Experimental Probability
- Probability Games With Dice
- Probability Games
- Theoretical Probability
- Probability Sample Space
- Math Probability
- Compound Probability
- Probability and Statistics
- Genetics Probability
- Conditional Probability
- Probability Lesson Plans
- Simple Probability


