Concord Consortium
Systematic Solution I
Writing a general rule to model a specific pattern is a high-level skill. Your classes practice the important skill as they write rules describing the solutions to a system of equations with variable coefficients. As an added challenge,...
Curated OER
Telescope #2
Learners investigate parabolas as the shape of a telescopic lens. In this Algebra I/Algebra II instructional activity, students explore the relationship between the coefficients of a quadratic function and the shape and position of the...
Curated OER
Parabolas
High schoolers investigate parabolas and their equations. In this parabolas and their equations lesson, students graph quadratic equations on their graphing calculator. High schoolers find the axis of symmetry of a parabola. Students...
Concord Consortium
Look but Do Not Touch
We seem to keep missing each other. A short task provides pupils with a quadratic function, as well as a linear function with a missing coefficient. They must determine the value of the coefficient for which the graphs do not intersect.
Curated OER
Who am I? Find A Polynomial From Its Roots
High schoolers generate the equation of a polynomial given its roots and the end behavior of the function. They need to apply theorems concerning the multiplicity of roots, conjugates of irrational or imaginary roots to find a...
Curated OER
United States Population: Using Quadratic Models
In this United States population worksheet, students solve word problems about the United States population by using the quadratic formula. Students complete 6 problems.
Curated OER
Graphing at all Levels: It's a Beautiful Thing!
Mixing math and art is done in this lesson by applying graphing knowledge to create a unique piece of art. This lesson varies acording to the graphing knowledge of the artist. First, learners identify and review various types of graphing...
Balanced Assessment
Transformation I
Rewriting expressions in different forms is an essential algebra skill. Support the development of this skill by using a task that asks scholars to begin with a linear, quadratic, and rational expression and then manipulate them into a...
Alabama Learning Exchange
Explore the Transformations of Linear and Absolute Value Functions Using Graphing Utilities
Students explore the concept of transformations. For this transformation lesson, students use an applet that is an interactive absolute value graph applet. Students manipulate the applet to examine the change in the function and how it...
Alabama Learning Exchange
There's Gold in Them There Hills
Need to build a laser fence on Mars? For this cute maximizing-area lesson, young explorers pretend to be prospectors on Mars and must determine the best way to use 20 meters of fencing in order to maximize their area. In addition, they...
EngageNY
Relationships Between Two Numerical Variables
Working in small groups and in pairs, classmates build an understanding of what types of relationships can be used to model individual scatter plots. The nonlinear scatter plots in this lesson on relationships between two numerical...
Illustrative Mathematics
Modeling London's Population
Looking at London's population from 1801–1961 in 20 year increments, high school mathematicians determine if the data can be modeled by a given logistic growth equation. They explain their thinking and determine the values of each...
Balanced Assessment
Transformation II
Develop a solid understanding of the manipulation of expressions to produce equivalent expressions. Given an expression, pupils rearrange it to create a new one. Their new functions must match the structure of the model expressions.
Bowland
Torbury Festival
Have you been to Torbury Fair? In the set of four lessons, learners solve a myriad of problems related to a music festival, including situations involving floods, market stalls, cows, and emergency plans.
Mathematics Assessment Project
Generalizing Patterns: Table Tiles
As part of a study of geometric patterns, scholars complete an assessment task determining the number of tiles needed to cover a tabletop. They then evaluate provided sample responses to see different ways to solve the same problems.
Concord Consortium
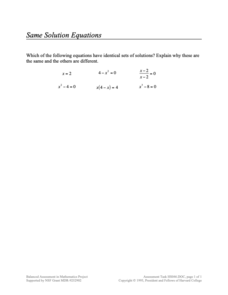
Same Solution Equations
Group equations by their solutions. Given six different equations, pupils determine which have the same solutions. Scholars explain why some are the same and some are different.
Curated OER
Graphs
For this algebra worksheet, students solve linear equations through graphing and quadratic equations through factoring. There are 4 questions dealing with systems of equations.
Curated OER
Writing in the Math Classroom
Learners determine the vertex, y-intercept and direction of a parabola and write an explanation of how to graph a parabola. They collect and graph data using a calculator.
Concord Consortium
In a Triangle
What's in a triangle? Just 180 degrees worth of angles! Young learners use given angle relationships in a triangle to write an algebraic representation. Using a system of equations, they simplify the equation to a linear representation.
Concord Consortium
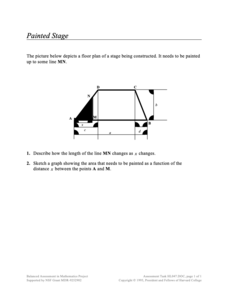
Painted Stage
Find the area as it slides. Pupils derive an equation to find the painted area of a section of a trapezoidal-shaped stage The section depends upon the sliding distance the edge of the painted section is from a vertex of the trapezoid....
Mathalicious
Pic Me!
Finally! Math and Instagram have come together to discuss the correlation between likes and followers. High schoolers can't help but want to discover what makes one account more popular than another by developing a line of best fit and...
Alabama Learning Exchange
I'm Lovin' It: Finding Area Between Curves
Students explore the concept of finding the area between two curves. In this finding the area between two curves instructional activity, students model the logos of McDonalds, Nike, and Motorola on grid paper. Students find functions to...
Alabama Learning Exchange
Technology for Displaying Trigonometric Graph Behavior: Sine and Cosine
Young scholars explore the concept of sine and cosine. In this sine and cosine lesson, students work in groups to graph sine and cosine functions. Young scholars examine how coefficients in various parts of each parent function shift...
EngageNY
Relationships Between Two Numerical Variables
Is there another way to view whether the data is linear or not? Class members work alone and in pairs to create scatter plots in order to determine whether there is a linear pattern or not. The exit ticket provides a quick way to...


