Curated OER
Ocean Color
Young scholars examine NASA's SeaWiFS Project Web site to explore how the SeaWiFS Project monitors environmental and climatic changes in the oceans and atmosphere. They answer questions and write a summary in support of continued funding...
Curated OER
Circle the Earth - Explore Surface Types on a Journey around Earth
Learners use CERES percent coverage surface data with a world map in locating landmasses and bodies of water at Earth's Equator.
Curated OER
Africa's Geographic Features
Fourth graders work in pairs and use atlases to locate specific geographic features in Africa. They use the Internet to view these geographic features.
Curated OER
Zones of Conflict
Learners read maps and identify specific countries involved in conflict. They classify countries in cultural realms. They relate maps to what they know about world conflict.
Curated OER
Home on the Range
Students use maps and mathematics to determine the appropriate panther population in a given area. In this Florida ecology lesson, students research the area requirements of male and female panther and use a map to help calculate how...
Other
Zoom Earth: Aerial and Satellite Images
Type in the location you are searching for, and satellite imagery will produce an aerial map for you. Helps students better understand these concepts by providing a visual for them.
Other
Satellite Images Bridge Understanding Gap Between Climate Change and Individuals
This article discusses how Google Earth has brought the reality of climate change to the average person so that they can see it for themselves. The north and south poles are indicators of what is happening with climate change and an...
Science Education Resource Center at Carleton College
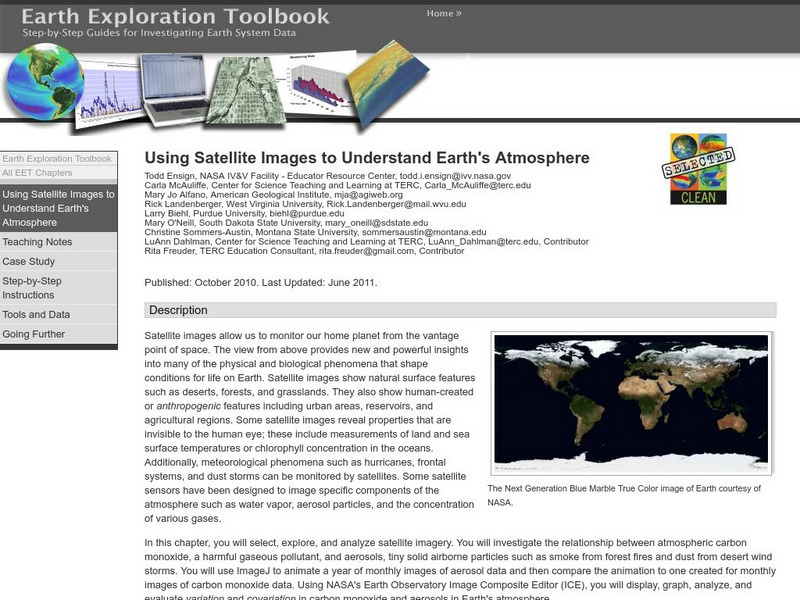
Serc: Using Satellite Images to Understand Earth's Atmosphere
This lesson helps young scholars select, explore, and analyze satellite imagery. Students investigate the relationship between atmospheric carbon monoxide and aerosols. Incorporate ImageJ to animate a year of monthly images of aerosol...
Columbia University
Nasa: Sedac: Applications of Satellite Remote Sensing
[Free Registration/Login Required] A collection of twenty-eight data sets from SEDAC (Socioeconomic Data and Applications Center) that examine ways in which remote sensing by satellites gives us useful information about the world....
Science Education Resource Center at Carleton College
Serc: Hurricanes
Nine learning modules for students to study hurricanes using satellite imagery and visualizations, and participate in some hands-on experiments. They'll also explore over 150 years of storm data to find out when and where these storms...
NASA
Nasa: Earth Observatory
The purpose of NASA's Earth Observatory is to provide new satellite imagery and scientific information about our home planet to the public. The focus is on Earth's climate and environmental change.
NOAA
Noaa: Imagery Portal
NOAA View provides access to maps of NOAA data from a variety of satellite, model, and other analysis sources. NOAA View is intended as an education and outreach tool and is not an official source of NOAA data for decision support or...
NOAA
Noaa: Operational Significant Event Imagery
This site contains satellite images from around the world organized by significant events such as dust storms, floods, severe weather, etc. Not very user friendly, but the images are there for those willing to search.
NASA
Nasa: Sea Wi Fs Project: Studying Ocean Color From Space
Five different oceanography topics are addressed by this resource. The first two topics deal with satellite imagery of the oceans and the last three address ecological issues.
Library of Congress
Loc: Earth as Art: A Landsat Perspective
A really cool site showing Satellite (Landsat 7) images of unique geographical and meteorological phenomena. Images show cloud formations to rainforest devastation.
University of Wisconsin
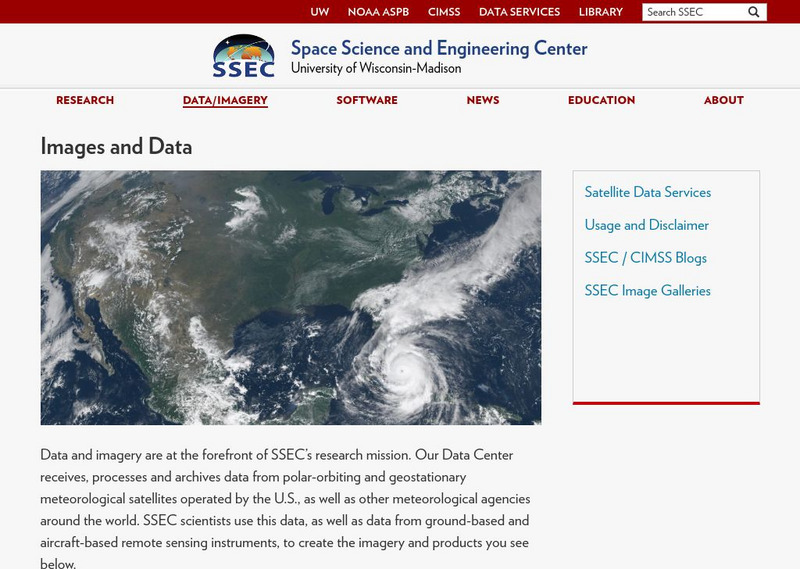
Ssec: Real Time Imagery and Data: Satellite Images of the Earth
Check out real-time satellite photos of the earth to study weather patterns.
Science Education Resource Center at Carleton College
Serc: Investigating the Ocean Algal Blooms
This NOAA computer-based activity is designed to teach students in grades 9-12 how satellite imagery and remote sensing can be used to monitor harmful algal blooms (HABs). This instructional activity teaches students how to read and...
Library of Virginia
Virginia Memory: Blank Space: Mapping the Unknown
How did early maps show the mapmakers' perception of the known world? Early mapmakers used maps drawn from coastal explorations, land travels, and even information heard word of mouth from American Indians or from colonists or traders....
European Space Agency
European Space Agency: Protecting Nature: Fighting Pollution by Tracking Trucks
Article explains how satellite technologies are used to track and combat pollucton.
PBS
Pbs Learning Media: What Causes the Gulf Stream?
This video segment adapted from NOVA uses satellite imagery to illustrate the Gulf Stream's path and animations to explain how atmospheric phenomena cause it to move. [1:51]
American Geosciences Institute
American Geosciences Institute: Earth Science Week: Exploring Change With Gis
Gives an overview of how Geographic Information Systems technology is used to monitor changes in conditions on the Earth. Provides a link to the website with lessons on using GIS. (Due to site changes, you may need to search for teachers...
Purdue University
Purdue University: San Francisco Bay Area Earthquakes
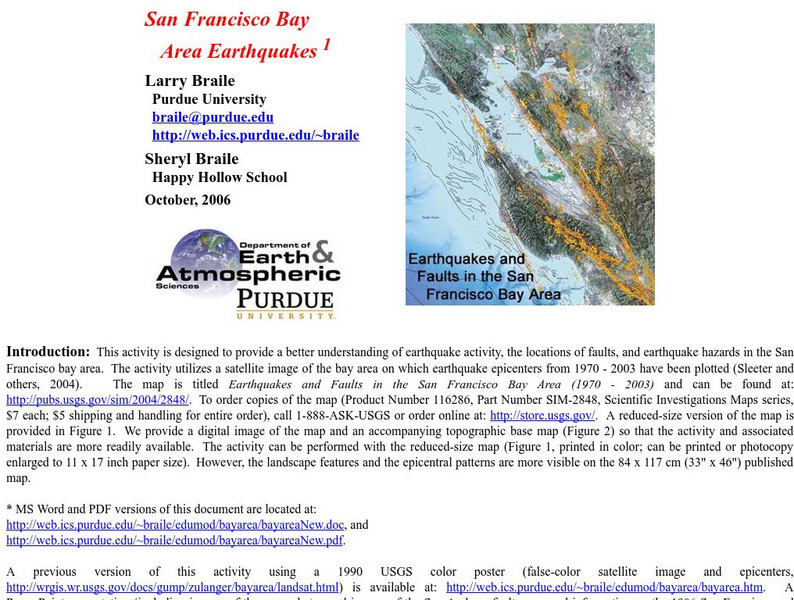
Students use geologic fault maps of the San Francisco Bay Area to find relationships between tectonic plate fault lines and landscape features, topographic features, and epicenters of past earthquakes.
Other popular searches
- Infrared Satellite Imagery
- Aerial and Satellite Imagery
- Science Satellite Imagery
- Satellite Imagery Weather Maps


