Annenberg Foundation
Annenberg Learner: Against All Odds: Describing Relationships
Video program showing how to use a scatter plot to illustrate relationship between response and explanatory variables, to determine patterns in variables, and to calculate least squares. Real-life examples -- manatee deaths per number of...
Texas Instruments
Texas Instruments: Math Today for Ti: Is Leisure Time Really Shrinking
Students will to organize data from the USA TODAY Snapshot, "Is leisure time really shrinking?," into two scatter plots and determine the quadratic model for each scatter plot. Students will determine if these graphs intersect and learn...
Texas Instruments
Texas Instruments: Scatterplots and Correlation With Ti 89
Students input data relating the values of one variable associated with values of another and use these data to generate a scatterplot. From the scatterplot, they determine whether there is a correlation between the two variables and...
CK-12 Foundation
Ck 12: Algebra: Applications of Function Models
[Free Registration/Login may be required to access all resource tools.] In this lesson students draw a scatter plot of data, find and draw the function that best fits that data, and make predictions from that information. Students watch...
CK-12 Foundation
Ck 12: Statistics: Scatter Plots on the Graphing Calculator
[Free Registration/Login may be required to access all resource tools.] This lesson covers finding the equation of best fit using a graphing calculator.
Shodor Education Foundation
Shodor Interactivate: Scatter Plot
Graph ordered pairs and customize the graph title and axis labels. Points are connected from left to right, rather than being connected in the order they are entered.
Texas Instruments
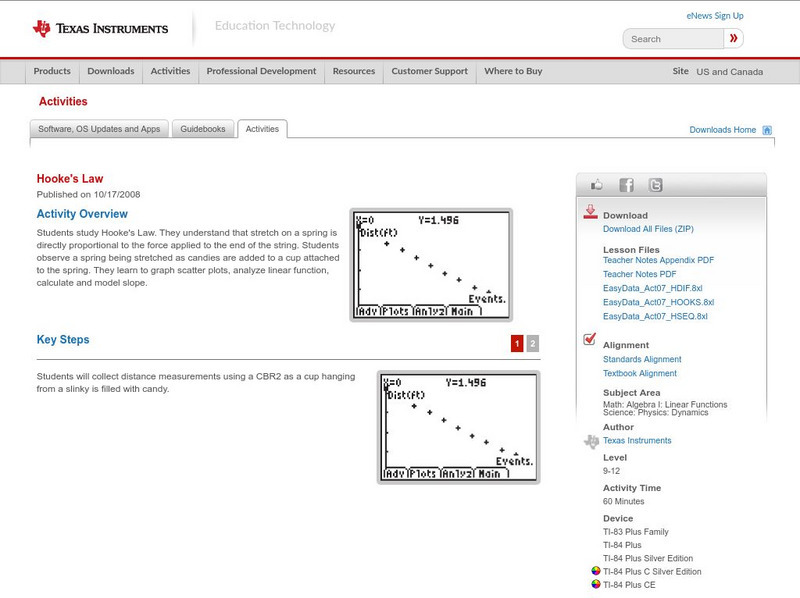
Texas Instruments: Hooke's Law
In this activity, students study Hooke's Law. They understand that stretch on a spring is directly proportional to the force applied to the end of the string. Students observe a spring being stretched as candies are added to a cup...
Texas Instruments
Texas Instruments: Glencoe Algebra 1: Graphing Calculator Investigation Curve
Students will make scatter plots and find the appropriate regression equations that best fit the data.
Texas Instruments
Texas Instruments: Need for Speed Adventure 2
Students use a radio controlled car and weights to record the time of each run and determine velocity. They represent motion graphically and determine the relationship between speed, time, and weight. Students create and interpret...
Texas Instruments
Texas Instruments: Height vs Arm Span
This is a quick class opener. That allow students to practice reading scatter plots and determining the correlation among data points.
Khan Academy
Khan Academy: Fitting Quadratic and Exponential Functions to Scatter Plots
Determine if a quadratic or exponential model fits a data set better, then use the model to make a prediction. Students receive immediate feedback and have the opportunity to try questions repeatedly, watch a video or receive hints.
Texas Instruments
Texas Instruments: Birthday Dot Plots
Using TI-Navigator, students' cursors become dots for a dot plot of what month they were born in.
Iowa State University
Iowa State Univ: Plotting Scatter Plot in X Gobi
Site explains how the XGobi computer program can be used to plot data in a scatter plot.
Texas Education Agency
Texas Gateway: Modeling Data With Linear Functions
Given a scatterplot where a linear function is the best fit, the student will interpret the slope and intercepts, determine an equation using two data points, identify the conditions under which the function is valid, and use the linear...
Texas Education Agency
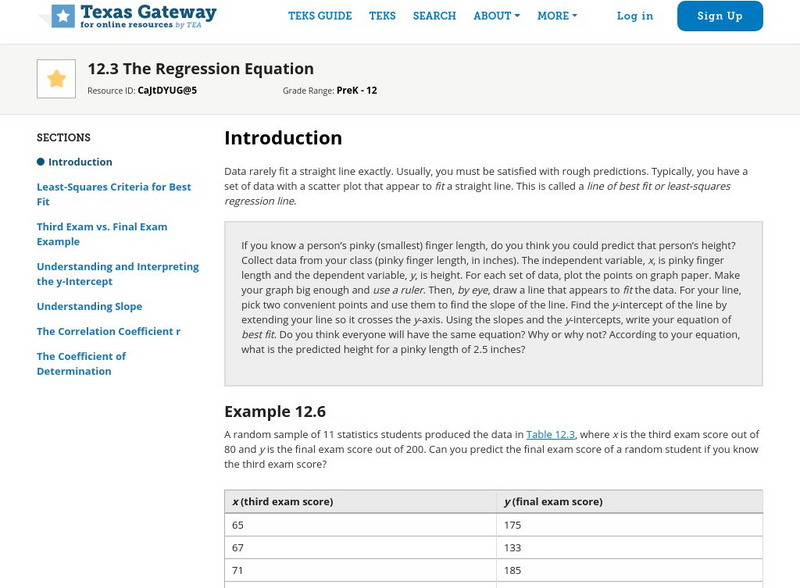
Texas Gateway: Tea Statistics: The Regression Equation
A tutorial on how to find the line of best fit or least-squares regression line for a set of data in a scatter plot using different methods and calculations.
University of Colorado
University of Colorado: Ph Et Interactive Simulations: Least Squares Regression
Create your own scatter plot or use real-world data and try to fit a line to it. Explore how individual data points affect the correlation coefficient and best-fit line.
Texas Education Agency
Texas Gateway: Analyzing Scatterplots
Given a set of data, the student will be able to generate a scatterplot, determine whether the data are linear or non-linear, describe an association between the two variables, and use a trend line to make predictions for data with a...
US Department of Education
National Center for Education Statistics: Create a Graph Tutorial
This tutorial walks students through how to create different types of graphs using the Create a Graph tool available on the website. Covers bar graphs, line graphs, pie charts, area graphs, scatter plots, and dependent and independent...
CK-12 Foundation
Ck 12: Statistics: Displaying Bivariate Data
[Free Registration/Login may be required to access all resource tools.] This Concept shows students how to display bivariate data using scatter plots and line plots.
Illustrative Mathematics
Illustrative Mathematics: S Id Coffee and Crime
This task addresses many standards regarding the description and analysis of bivariate quantitative data, including regression and correlation. Given a scatter plot, students will answer a variety of questions about linear relationships,...
Science Education Resource Center at Carleton College
Serc: The Evolution of Pearson's Correlation Coefficient
For this activity, students explore nine scatter plots to develop their understanding of how two quantitative variables are related. Through an exploration of the properties of this association, they come to understand the standard...
National Council of Teachers of Mathematics
Nctm: Figure This: Does It Make a Difference Where You Shop?
A math investigation that uses scatter plots to compare prices of favorite soft drinks. Discover how valuable your skills in organizing and displaying data can be in real life scenarios.
Varsity Tutors
Varsity Tutors: Hotmath: Algebra Review: Line Plot
Find a quick, concise explanation of a line plot. An example is given and clearly explained.
Scholastic
Scholastic: Cultivating Data
Students will understand key concepts of data analysis and their graphic representations. Students will construct and interpret data tables, line plots, box-and-whisker plots and stem-and-leaf plots, scatterplots with line of best fit,...
Other popular searches
- Math Scatter Plots
- Algebra Scatter Plots
- Creating Scatter Plots
- Candy Scatter Plots
- Data for Scatter Plots
- Pre Algebra/ Scatter Plots
- Interpreting Scatter Plots
- Prue Algebra/ Scatter Plots
- Halloween Scatter Plots
- Scatter Plots and Correlation
- Pr Algebra/ Scatter Plots
- Scatter Plots Ti 83


