National Wildlife Federation
Wherefore Art Thou, Albedo?
In the sixth lesson in a series of 21, scholars use NASA data to graph and interpret albedo seasonally and over the course of multiple years. This allows learners to compare albedo trends to changes in sea ice with connections to the...
Wild BC
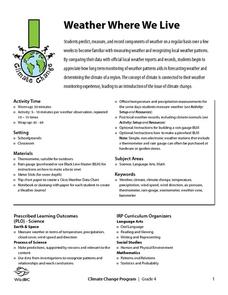
Weather Where We Live
Over a span of two weeks or more, mini meteorologists record weather-related measurements. What makes this particular resource different from others covering similar activities are the thorough details for the teacher and printables for...
Space Awareness
Greenhouse Effect
A greenhouse provides additional warmth and protection to the plants inside, but what if the greenhouse gets too hot? Pupils discuss and experiment with the difference between natural and anthropogenic greenhouse effect. They measure the...
NOAA
The Incredible Carbon Journey: Play the Carbon Journey Game
Class members explore the carbon cycle in the final installment of the 10-part Discover Your Changing World series. They play a simulation game where they walk through the steps carbon takes as it cycles through the different layers of...
Space Awareness
Oceans on the Rise
Temperature rises and land disappears! Through a lab exploration, learners understand the effect of temperature increase on water similar to the effect of global warming on our oceans. As they heat the water in a flask, they measure the...
Montana State University
Climb into Action!
Climate change affects even the largest and intimidating of landforms—even Mount Everest! A resource helps teach learners the connection between global climate change and its effects on Earth. Activities include videos, class discussion,...
PBS
The Cat in the Hat Activity Exploring Weather
Observe different types of weather right in your classroom! Here, pupils look at clouds, rain, snow, wind, and hot and cold temperatures, and observe these weather patterns at school. They keep track of their observations in a worksheet...
University of Connecticut
Weather Vs. Whether
Monarch butterfly populations have decreased by 90 percent over the past 20 years due to misuse and ineffectiveness of some pesticides. Given the challenge to increase pesticide safety and effectiveness, the class, through discussion,...
Curated OER
Greenhouse Gases
Although the worksheet for the lab activity is not included, this is an activating activity for your class to do when learning about the greenhouse effect. They lay three thermometers underneath a lamp: one out in the open, one under a...
Montana State University
Ice in Action
Make your own bite-size glacier! A resource teaches about the formation and melting of ice. Activities include videos, a hands-on activity where your pupils build glaciers, and a photographic analysis to teach individuals the chilling...
Curated OER
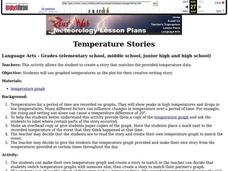
Temperature Stories
Students create a story that matches the provided temperature data. They use graphed temperatures as the plot for their creative writing story.
Curated OER
Communities and Biomes
In this communities worksheet, students will look at the interactions between biotic and abiotic factors and the effect these factors have on organism populations. Students will also order the succession steps that occur over time in an...
Curated OER
Equilibrium Review Sheet
In this equilibrium worksheet, learners answer 5 questions about reactions reaching equilibrium, the concentration of the products and reactants when they reach equilibrium, and the effects of temperature changes, quantities of reactants...
NOAA
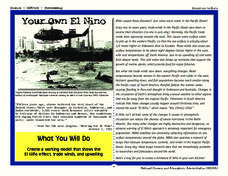
Your Own El Nino
Scholars make a model to discover how the force of trade winds over the Pacific Ocean creates an El Niño. Super scientists observe how the severe weather affects life in water and on land.
Space Awareness
Water is a Heat Sink
One of the key objectives of Europe's Copernicus Earth program is to monitor the temperatures of the oceans and seas on Earth. Young scholars learn the effects of different heat capacities through two experiments. These experiments...
Orange County Water Atlas
Location, Location, Location…
Young geographers discover not only how to read and recognize coordinates on a map, but also gain a deeper understanding of latitude and longitude and how climate changes can vary significantly across latitudes.
Polar Bears International
Taking Action!
Motivate young scientists to stand up and take action with this environmental science lesson. To begin, the class works in small groups brainstorming actions that support the conservation of the earth before creating and implementing an...
It's About Time
What Drives the Plates?
It's getting hot in here! Lead your emerging geoscientists on a thrilling journey as they calculate liquid densities to determine forces that stimulate thermal plates from within the earth's crust. They explore effects of temperature on...
Curated OER
Using the Very, Very Simple Climate Model in the Classroom
Young scholars study the relationship between the average global temperature and carbon dioxide emissions. In this weather lesson students develop a test scenario using a model then read and interpret graphs of data.
Curated OER
Graphing Changes in Weather
Students graph current temperature and weather conditions for three days. In this weather lesson, students go to the Weather Channel's website and look up weather for their zip code then graph the conditions and record the current...
Curated OER
Global Warming Investigation Guide
Students expllore the issue of global warming. They investigate how temperature changes naturally over time and by location. In addition, they explore the different areas where human activities might be affecting
climate and write a...
Curated OER
Playground Changes
Students develop both writing and artistic skills as they document changes in their school environment. They observe how the environment of their school playground changes throughout the year by drawing and describing plants, animals,...
Curated OER
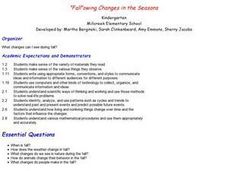
"Fall"owing Changes in the Season
Students create a whole class A-B-"C"eason Book. Each student is responsible for creating a "letter" page relating to changes, adaptations, or other fall concepts. After hard copies of the class ABC books are created, the teachers using...
Curated OER
Heating the Atmosphere
Students construct a thermograph for maximum and minimum temperatures for the 2-week period. They illustrate how the earth's atmosphere is heated by convection and conduction currents and evaporation of water.


