Curated OER
Lines, Lines, Everywhere
Students explore linear equation suing real life scenarios. In this algebra lesson plan, students find the slope and intercept of a line. They create table of values to plot their graph and draw conclusions.
Curated OER
Impossible Graphs
Students distinguish between possible and impossible graphs of functions, and to learn why some graphs are impossible. They have practiced plotting functions on the Cartesian coordinate plane
Curated OER
Graphs and Ellipses
Students explore linear graphs, the parabola and the rectangular hyperbola.
Curated OER
Usage and Interpretation of Graphs
Students review graphing and use processing skills to solve problems.
Curated OER
Maps, Charts, and Graphs
Students define key geographic terms and track a hurricane on a map. They examine various types of maps and find locations on them,including rivers, cities and mountains.
Curated OER
Decode Word Is..
Students solve problems using patterns. In this algebra lesson plan, students identify the relation, domain and range of a function. They graph functions using coordinate pairs.
Curated OER
Graphing Integers On a Coordinate Plane
Seventh graders explore the concept of graphing integers on a coordinate plane. In this graphing integers on a coordinate plane lesson, 7th graders discuss scenarios where coordinate systems are used in real life. Students represent...
Curated OER
Cartesian Coordinate System
Students research the Cartesian Coordinate System and its many uses in the world of mathematics and algebra.
Curated OER
Pet Count Excel Graphing
Learners used collected data to distinguish what pets they have or would like to have. They correlate findings with appropriate technology--Excel. At the end of the lesson they tabulate a bar chart and present their findings to the class.
EngageNY
Four Interesting Transformations of Functions (Part 1)
Understanding how functions transform is a key concept in mathematics. This introductory lesson makes a strong connection between the function, table, and graph when exploring transformations. While the resource uses absolute value...
Willow Tree
Midpoint and Distance Formulas
The shortest distance between two points is a straight line. Learners use the Pythagorean Theorem to develop a formula to find that distance. They then find the midpoint using an average formula.
Illustrative Mathematics
Introduction to Linear Functions
Introduce your algebra learners to linear and quadratic functions. Learners compare the differences and relate them back to the equations and graphs. Lead your class to discussions on the properties of a function or a constant slope...
Geophysical Institute
Latitude and Longitude with Google Earth
Travel the world from the comfort of your classroom with a lesson that features Google Earth. High schoolers follow a series of steps to locate places all over the earth with sets of coordinates. Additionally, they measure the distance...
EngageNY
Four Interesting Transformations of Functions (Part 3)
Continue the study of transformations with an examination of horizontal stretches, shrinks, and reflections. Individuals use the same process used in parts one and two of this series to examine horizontal changes. The resource also...
EngageNY
Multi-Step Problems in the Real World
Connect graphs, equations, and tables for real-world problems. Young mathematicians analyze relationships to identify independent and dependent variables. These identifications help create tables and graphs for each situation.
Shodor Education Foundation
InteGreat
Hands-on investigation of Riemann sums becomes possible without intensive arithmetic gymnastics with this interactive lesson plan. Learners manipulate online graphing tools to develop and test theories about right, left, and...
EngageNY
Motion Along a Line – Search Robots Again
We can mathematically model the path of a robot. Learners use parametric equations to find the location of a robot at a given time. They compare the paths of multiple robots looking for parallel and perpendicular relationships and...
EngageNY
Federal Income Tax
Introduce your class to the federal tax system through an algebraic lens. This resource asks pupils to examine the variable structure of the tax system based on income. Young accountants use equations, expressions, and inequalities to...
Project Maths
Introduction to Patterns
The world is full of patterns. Help learners quantify those patterns with mathematical representations. The first Algebra lesson in a compilation of four uses a series of activities to build the concept of patterns using multiple...
EngageNY
Ferris Wheels—Tracking the Height of a Passenger Car
Watch your pupils go round and round as they explore periodic behavior. Learners graph the height of a Ferris wheel over time. They repeat the process with Ferris wheels of different diameters.
EngageNY
Solving Quadratic Equations by Completing the Square
Many learners find completing the square the preferred approach to solving quadratic equations. Class members combine their skills of using square roots to solve quadratics and completing the square. The resource incorporates a...
Missouri Department of Elementary
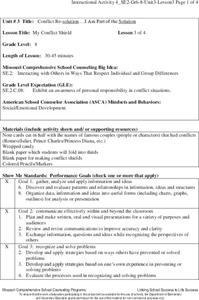
My Conflict Shield
As an exercise in self-awareness and improvement, class members create a Conflict Shield listing 12 skills they believe are the most useful in conflict resolution. They then color the ones they have mastered while leaving uncolored those...
EngageNY
An Appearance of Complex Numbers 2
Help the class visualize operations with complex numbers with a activity that formally introduces complex numbers and reviews the visualization of complex numbers on the complex plane. The fifth installment of a 32-part series...
02 x 02 Worksheets
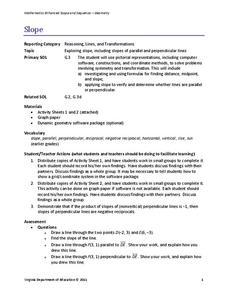
Slope
What does slope have to do with lines? Pupils work with lines and determine the slope of the lines informally and with the slope formula. Groups use their knowledge to calculate the slopes of parallel and perpendicular lines. They also...


