Curated OER
The Five Senses - Observation, Experimentation, Prediction, and Categorization.
First graders engage in this creative and well-designed lesson. They rotate through five learning stations, each devoted to one of the senses. They practice observation, experimentation, prediction, and categorization.
Captain Planet Foundation
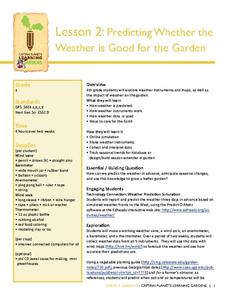
Predicting Whether the Weather is Good for the Garden
Can your class predict the weather? Show them how they can come close with a lesson about creating weather instruments, including weather vanes, barometers, wind socks, anemometers, and thermometers. Kids research weather patterns and...
US Department of Agriculture
Sink or Float?
Will it sink or will it float? Learners predict the outcome as they drop random objects into a container of water. Then, they keep track of the results and record the data in a t-chart to draw a final conclusion.
Cornell University
Sound Off!
Time to witness the effects of sound. Learners analyze different materials to determine their abilities to absorb sound waves. They use free software to monitor the amplitude of the waves to verify results.
Intel
Track the Trends
Allow your classes to research what interests them. An engaging STEM lesson, the fourth in the series of six, asks individuals to choose a topic of interest and analyze the data through regression models. The regression equations allow...
California Education Partners
Science Fair Project
Plant the data firmly on the graph. Given information about the growth rate of plants, pupils determine the heights at specific times and graph the data. Using the information, scholars determine whether a statement is true and support...
EngageNY
Analyzing Residuals (Part 1)
Just how far off is the least squares line? Using a graphing calculator, individuals or pairs create residual plots in order to determine how well a best fit line models data. Three examples walk through the calculator procedure of...
EngageNY
Analyzing Residuals (Part 2)
Learn about patterns in residual plots with an informative math activity. Two examples make connections between the appearance of a residual plot and whether a linear model is the best model apparent. The problem set and exit ticket...
Balanced Assessment
Monitor Pricing
Out with the old and in with the new. Learners use a set of prices of computer monitors from 1994 to make a prediction. They then use one current price and what they know about the old prices to make a more recent prediction. Their...
101 Questions
Coins in a Circle
Round and round you'll go! Learners watch as different-sized circles fill with coins. They collect data and then make a prediction about the number of coins that will fit in a large circular rug.
Statistics Education Web
The United States of Obesity
Mississippi has both the highest obesity and poverty rate in the US. Does the rest of the data show a correlation between the poverty and obesity rate in a state? Learners tackle this question as they practice their skills of regression....
Curated OER
Creating a Thematic Map
Students create and analyze a weather-related data table and a thematic map based upon information provided.
EngageNY
Modeling an Invasive Species Population
Context makes everything better! Groups use real data to create models and make predictions. Classmates compare an exponential model to a linear model, then consider the real-life implications.
Willow Tree
Approximating a Line of Best Fit
You may be able to see patterns visually, but mathematics quantifies them. Here learners find correlation in scatterplots and write equations to represent that relationship. They fit a line to the data, find two points on the line, and...
5280 Math
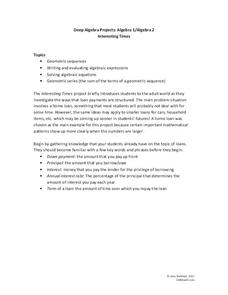
Interesting Times
Gain a little interest in functions with a real-life task. Young scholars analyze home loan data with a geometric sequence and series. They use the models to make predictions about the total loan payments at certain intervals in a useful...
Kenan Fellows
Let's Move
Find a statistical reason for a fresh start. Using a hypothetical scenario, individuals research statistical data of three different cities. Their goal? Find the best statistical reason for a business to move to a new location. Their...
Curated OER
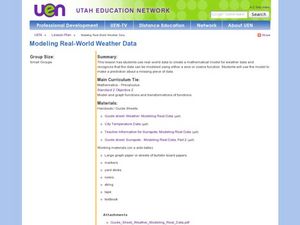
Creating a Mathematical Model Using Weather Data
Students explore the concept of mathematical models. In this mathematical model lesson, students create a mathematical model from data from 4 cities over 15 months. Students are told they are working for a weather station. Students...
Curated OER
Play It
There are a number of activities here that look at representing data in different ways. One activity, has young data analysts conduct a class survey regarding a new radio station, summarize a data set, and use central tendencies to...
Curated OER
Statistics and Shopping
Explore how statistics are used in everyday life. Your soon-to-be savvy consumers use the Internet to find consumer-related statistical information and learn to make wise consumer decisions. Includes links to a practice sheet about data...
Curated OER
Meteorological Predictions
Students make a link between prediction and hypothesis in math and science. Based on data collected over one week, students evaluate the predictions of local weather forecasters, compare the predicted outcomes to the actual weather...
Curated OER
Data and Probability- What's the Chance?
Students investigate probability through a game. In this data lesson plan, students use dice and predictions to explore how probability works.
Curated OER
Data Analysis, Probability, and Discrete Mathematics: Lesson 4
Eighth graders investigate the concepts of probability while performing data analysis. They apply statistical methods in order to measure or predict some possible outcomes. The information is collected and graphed, 8th graders analyze...
Curated OER
Organizing And Reading Data
Students complete three parts of an "Organizning and Reading Data" worksheet. First, they go over the rubric to determine the work will be scored. They organize data by taking tallies, make a pictograph and a bar graph using the data....
Curated OER
The Dog Days of Data
Students practice an alternative form of data presentation. They practice sequencing data, identifying the stem-and-leaf, creating stem-and-leaf plots, and drawing inferences from the data by viewing the plots.


