Weather Bug
WeatherBug
Exploring the weather has never been more intriguing! Whether you are looking for a quick glance at the 10-day forecast, trying to figure out if lightning is heading your way, or wondering what the pollen count is, you will find out...
Polar Trec
Global Snow Cover Changes
Snow is actually translucent, reflecting light off its surface which creates its white appearance. Pairs or individuals access the given website and answer questions about snow cover. They analyze graphs and charts, examine data, and...
Curated OER
Weather and its Effect on the Environment and Settlement
Students, after choosing two diverse cities, collect data on weather for a month and construct a graph on temperature and precipitation. After collecting population data of said cities, and graphing it, they plot population on a large...
Curated OER
Weather "Whys" : Introduction to Weather
Students discuss weather forecasts and different types of weather. In this weather instructional activity, students observe the weather and learn a weather song. They listen to a story and see weather measurement tools.
Curated OER
Charting the Weather
Students research and conduct non-experimental research, such as journals, the weather channel and the internet, to collect and record data for analysis on weather conditions in the United States and abroad. They identify, pronounce and...
Curated OER
Observing and Predicting Weather from a Weather Station
Fourth graders us a Weather Log data chart to record the date, time, day, and weather. They discuss different instruments and charts needed to record the information. Students turn in their weather logs at the end of two weeks and...
Curated OER
Storm Clouds-- Fly over a Late Winter Storm onboard a NASA Earth Observing Satellite
Students study cloud data and weather maps to explore cloud activity. In this cloud data lesson students locate latitude and longitude coordinates and determine cloud cover percentages.
Curated OER
Weather Observations
Students record the weather using an outdoor thermometer. In this weather instructional activity, students compare their recordings to that on the weather map online. Students explain the differences of each weather reading. Students...
Curated OER
The Fabled Maine Winter
Learners graph and analyze scientific data. In this research lesson plan students use the Internet to obtain data then draw conclusions about what they found.
Curated OER
A Comparison of Cloud Coverage over Africa
Young scholars identify different climate regions and local weather patterns. For this cloud coverage lesson students use NASA satellite data and import it into Excel.
Curated OER
Differences Between Ground and Air Temperatures
Students examine the differences between air temperature and ground temperature. In this investigative instructional activity students find NASA data on the Internet and use it to create a graph.
Curated OER
Dry Season and 'Green' Season in Costa Rica
Students explore the seasonal changes in Costa Rica. In this dry season activity students use the Internet to locate science data then generate data for precipitation.
Curated OER
Solar Cell Energy Availability From Around the Country
Young scholars determine areas that are the most likely to produce solar energy by using NASA data. In this solar energy instructional activity students analyze plots and determine solar panel use.
Curated OER
El Niño ~ The Return of El Niño
El Niño sure creates a stir when it comes around! Why not stir up your earth science class with this data analysis activity that examines the temperature and precipitation over the 2002-2003 water year. A tracking chart is provided...
Curated OER
Weather Lesson Five
Students define a weather forecast, make a forecast using a weather map, identify three prediction guidelines, and explain how computers help to make forecasts. Students make a 24-hour forecast for each of the thirteen states targeted.
PBS
Twirling in the Breeze
Blow classes away with a hands-on lesson investigating wind speed. Learners use common materials to design and construct anemometers. They then test their anemometers and collect data on the wind speed created by a fan.
World Wildlife Fund
Land of the Midnight Sun
From days of 24 hour sunlight, to endless nights that last for days, the Arctic is a very unique place to live. Examine the seasonal changes that occur in the northern-most reaches of the globe and the impact they have on the plants and...
Texas Instruments
Endothermic and Exothermic Processes
Students investigate temperature using the TI. In this chemistry lesson, students analyze the change in temperature, as chemicals are dissolved in water. They analyze data collected using the CBL 2.
Curated OER
Weather v. Climate
Ninth graders discuss the differences between climate and weather as a class. Using data they collected, they create a graph of the data to share with the class over a specific time period. They compare and contrast this data with...
Curated OER
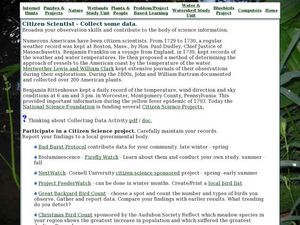
Citizen Scientist - Collect Some Data
In this science project worksheet, students view a sheet of numerous science projects including weather, animals, flowers, and more. Students choose 1 project to do out of 22 projects total.
Curated OER
Clam Shell Data Collection Sheet
In this clam shell worksheet, students collect data about 10 clams and measure their length and width. They identify if the clam has a hole or not in its shell and they indicate the location profiled, date, time of day, tidal stage and...
Curated OER
Weather: The Climate
Students observe the weather each day and record what he or she sees. They can record his or her data in any appropriate manner, from drawing pictures of a sunny sky to recording the temperature and rain fall on a chart.
Curated OER
MAISA and the REMC Association of Michigan
Students complete online research to study geography's impact on weather. In this geography and weather lesson, students research weather in their city for ten days using an online website. Students bookmark the site, enter data into a...
Curated OER
Investigation 6 - Collecting Weather Data
Fourth graders collect data for two weeks. They start seeing patterns and make predictions. They can predict what the weather be like the next day and for the next few days. They see if their predictions were correct from the previous day.
Other popular searches
- Collect Data Weather
- Recording Weather Data
- Collecting Weather Data
- Graphing Weather Data
- Weather Data Collection
- Data About Weather
- Analyzing Weather Data
- Math Data Graph Weather
- Weather Data Projects
- Gathering Weather Data
- Weather Log Data Sheets
- Data Analysis Weather


