Curated OER
Power In The Wind
Students experiment designing graphs of selected readings from the Nebraska sites from the Power in the Wind study. They choose whether or not to put their data in a spreadsheet program to make a computer-generated graph or to complete...
Curated OER
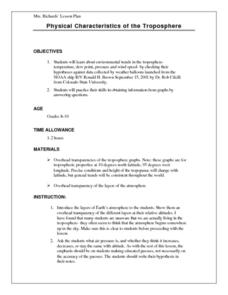
Physical Characteristics of the Troposphere
Students lexplore environmental trends in the troposphere- temperature, dew point, pressure and wind speed- by checking their hypotheses against data collected by weather balloons.
Curated OER
Physical Characteristics of the Troposphere
Students examine troposphere graphs and mcompare their hypotheses with data collected by weather balloons launched from the NOAA ship, Ronald H. Brown. they write summaries about the physical properties of the troposphere.
Curated OER
Manage Soil
Learners identify and classify soil ypes according to data on the soil triangle. Given examples, students identify soil conservation practices, using criterion assessment instrument. When giving a case situation involving soil...
Curated OER
CO Buildup City
Students conduct a controlled experiment. They collect data in an organized manner. Students analyze data to reach a conclusion and communicate findings. They explain how city size, temperature, and pollution is related to the air quality.
Curated OER
Comparing Temperatures of US REgions
Third graders explore regional factors that affect daily temperature. They collect data on three cities in the northeast, southeast and midwest regions of the US for two weeks. The Weather Channel website is used each day to collect...
Curated OER
Planet X
Pupils select a wide variety of presentation methods to compare Planet X and Earth. Students share these with their classmates. Pupils select other methods to present their ideas about a livable planet for human life forms. Students...
Curated OER
Ozone Layer
Seventh graders develop an understanding of the ozone layer, it's affect on Earth, and the effect of human activity on the ozone layer. They then interpret data from satellite pictures and develop an understanding of longitude/latitude...
Curated OER
Calculating Profits from Selling Virtual Lemonade
Students set up and collect data for a virtual lemonade stand. In this entrepreneurship, economics, and technology lesson, students purchase ingredients, determine costs, and set up a virtual lemonade stand. Students consider weather...
Curated OER
El Nino
Learners explain what El Nino is, where it is located and how it is created. They describe the weather changes caused by El Nino. They draw the patterns of El Nino on a world map. They predict economic effects El Nino has on the areas it...
Ohio Department of Education
Observe Then Infer
Upper elementary scientists learn that observations made can lead to inferences. They rotate through six weather-related stations that challenge them to make observations and then draw inferences from their observations. A...
Curated OER
Microclimates of Our School
Students read the story "Weslandia" by Paul Fleischman, define the term microclimate, gather and record data in various places on school grounds to establish the presence of difference microclimates, analyze and compare microclimates,...
Curated OER
Conditions at Sea
Young scholars examine wave formation. In this wave lesson, students discover how waves are formed and how the weather at sea is predicted. Young scholars study ocean vocabulary and understand the Beaufort Wind Force Scale.
Curated OER
Paint Property Experiments
Young scholars identify various kinds of paints by using the scientific method. In this solvents instructional activity students collect data and identify paint samples while working in teams.
Curated OER
Seasoning the School Year
Students observe the changes a class tree goes through as the seasons change and record observations in journals. They investigate changes in the weather, changes in the length of the day, and how that affects people. They create...
Curated OER
Chasing El Niño
Students view a video clip about the effects of El Nino. They work together to develop a question about weather folklore. They participate in an experiment that tests their hypothesis.
Curated OER
Boston Harbor Cruise: A Shoreline Survey
The students take a harbor cruise, photograph, and draw shore line features attending to evidence of human impact/consequences, and its cost on marine/land animal habitats vegetation, weather patterns, signs of erosion, and the water...
Curated OER
The Hudson's Ups and Downs
Fifth graders practice interpreting line graphs of the Hudson River water levels to assess the tides and tidal cycles in the estuary. They explore how weather can affect water levels and tides and observe that high tides and low tides...
Curated OER
"Graphing Your Motion"
Students study the concepts of motion, velocity, and acceleration through graphing their own movement using LoggerPro. They explain the difference between speed and velocity using the weather vane example. They discover the difference...
Curated OER
Rain On
Fourth graders study the water cycle and clouds. In this water cycle and cloud lesson plan, 4th graders determine the definition of condensation and watch a demonstration in which the teacher makes a cloud in a bottle. They discuss the...
Curated OER
My Community
First graders design a Powerpoint presentation to reflect information about their community. In this community lesson, 1st graders create slides to explain the weather, geography and other information about the city.
Curated OER
Internet Project - Project Groundhog
Students share weather and community information with other students across the continents. In groups, students collect details, pictures, and drawings about their community, its weather patterns, and school. They predict if groundhog...
Curated OER
Understanding Cloud Formation
Students read and relate the poem, "Clouds" by Aileen Fisher to a demonstration on cloud formation. They create clouds in jars using ice water and matches then discuss the ways clouds can be used to predict weather.
Curated OER
Watch the Sky
Learners describe the atmosphere, weather conditions, and climates. They describe seasonal changes in weather, the composition and characteristics of the atmosphere. Students describe patterns of changing weather and how they are...
Other popular searches
- Collect Data Weather
- Recording Weather Data
- Collecting Weather Data
- Graphing Weather Data
- Weather Data Collection
- Data About Weather
- Analyzing Weather Data
- Math Data Graph Weather
- Weather Data Projects
- Gathering Weather Data
- Weather Log Data Sheets
- Data Analysis Weather


