Curated OER
Hurricane Katrina
In this science learning exercise, students find the words while learning the vocabulary of Hurricane Katrina. The answers are found at the bottom of the page.
Curated OER
Dateline: El Niño
Students explore El Nino and take the role of a reporter gathering the facts for a news story. Reports are presented orally, like a newscast, written or in whatever form the teacher prefers.
Curated OER
What Causes Irregular Temperature Patterns?
Students examine common trends in climate across the U.S. They identify the anomalies in hot-cold temperature differences in the U.S and locate them on the map using latitude and longitude coordinates.
Curated OER
Hectic Hurricanes!
Students determine what they know about hurricane formation. They experiment to explain hurricane formation and track a hurricane that forms in the Caribbean Islands.
Curated OER
Make a Bar Graph
In this bar graphs worksheet, students use the tally chart to make a bar graph. Students color one box for each tally mark and then use the chart to help answer the questions about the sunny, cloudy, and rainy days.
Curated OER
Evidence of Change Near the Arctic Circle
Students analyze graphs and make conclusions about climate change. In this climates lesson students produce graphs and identify relationships between parameters.
Curated OER
A Comparison of Land and Water Temperature
Students examine NASA satellite observations of surface temperature and investigate the seasonal changes of land and water temperature.
NOAA
The Cycle of Water
Young water cycle enthusiasts discover the water they have been using has been cycling around the earth for billions of years. Through presentations, learners will understand that water has three states and how these forms...
Curated OER
Winter Holiday Celebrations
Young scholars understand how holidays revolve all around light. In this winter holidays lesson, students find the similarities and differences between the winter holidays. Young scholars discuss the winter solstice and how it relates to...
Curated OER
Troical Atlantic Aerosols
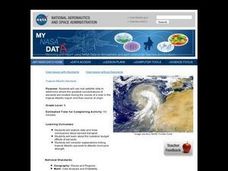
Students explore the effect aerosols have upon he weather and climate. They observe NASA satellite images to explore and draw conclusions about aerosol transport. From studying the images, students track the path of aerosols. They...
Curated OER
Linking Algebra to Temperature
Students convert between two units as they calculate the temperature. In this algebra lesson, students collect data on seasonal climate and create a graph. They make conjectures based on their data collection.
Curated OER
Database
Second graders collect daily weather information and introduce them to databases.
Curated OER
Rain Shadows and Sea Breezes
Students plot the average rainfall for a variety of cities in the United States. Using the map, they work together to determine patterns on which toxicants are transported through the air. They determine the impacts of various weather...
Curated OER
School Temperatures
Students collect and record temperatures throughout the school. Using this information they compare and contrast the temperatures recorded from various spots throughout the school.
Curated OER
Animal Trackers
Learners use space technology to monitor migratory species, map their movements, and gather data about their habitats and possible responses to climatic shifts.
Curated OER
If You Can’t Stand the Heat
Students design and build their own solar cooker. In this math lesson, students determine the relationship between the angles of the sun, reflection and cooking time of the solar cooker. They test their project, collect data and...
Curated OER
Shining the Light on Skin
Students investigate the relationships between certain environmental factors and levels of exposure to sunlight. The variables of location, time of year, and day, and the weather which affect the intensity of the sun are explored in this...
Curated OER
Hurricanes
Learners use the internet to research the characteristics of hurricanes. Using this information, they read about past hurricanes and use a weather map to trace current disturbances in the oceans. They also discuss hurricane safety and...
Curated OER
You Can Take the Pressure!
Students construct and use a barometer over a period of 1-2 weeks to investigate and predict upcoming weather from barometric pressure.
Curated OER
Introduction to Dissolved Oxygen and Demonstration of a Simple Test Procedure
Young scholars explain the importance of dissolved oxygen in water ecosystems. They describe the aquatic oxygen cycle and the effect of water pollution on oxygen. They make observations, collect data and draw a conclusion.
Curated OER
Dew Point
Fourth graders investigate saturation conditions and measure the dew point. They conduct an experiment, record data on a worksheet, and measure the dew point in the experiment.
Curated OER
757 Glider Kit
Students work together to complete a 757 Glider kit. They use a GPS to discover how it operates in all weather landings. They complete different obstacles with the glider as well.
Curated OER
Graphing Temperatures
Students identify current temperatures for different regions of the United States. Using current information, they develop hypothesis for the temperature in the same region tomorrow. They use the Weather Channel website to find actual...
Curated OER
Weather for Health
Ninth graders encounter various types of numerical information (represented in multiple ways), much of which is abstract and difficult to comprehend. In this instructional activity, 9th graders will convert given information into bar...
Other popular searches
- Collect Data Weather
- Recording Weather Data
- Collecting Weather Data
- Graphing Weather Data
- Weather Data Collection
- Data About Weather
- Analyzing Weather Data
- Math Data Graph Weather
- Weather Data Projects
- Gathering Weather Data
- Weather Log Data Sheets
- Data Analysis Weather


