Illustrative Mathematics
Find the Missing Number
First graders are asked to find the missing numbers in subtraction and addition equations. Each missing number is represented with a box and appears as an addend, subtrahend, sum, or difference.
Illustrative Mathematics
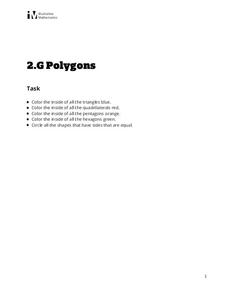
Polygons
Identify shapes based on their attributes. Second graders are tasked to color triangles, quadrilaterals, pentagons, and hexagons specific colors. The one thing these shapes have in common? They are all polygons.
Illustrative Mathematics
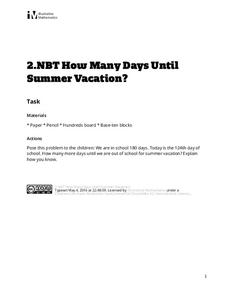
How Many Days Until Summer Vacation?
On the 124th day of school, young mathematicians are asked to find out how many days are left in the 180-day school year. The teacher version to the task offers several ways the problem can be solved, and can be used to guide...
Illustrative Mathematics
Ordering 3-Digit Numbers
Second graders are asked to order two sets of two- and three-digit numbers from greatest to least, and then least to greatest.
Illustrative Mathematics
Party Favors
Pia is putting stickers into party bags. She starts by putting 10 stickers in each bag, and over the course of a week she adds several bundles of ten stickers to each bag, as well as making more bags. Second graders must find the number...
Illustrative Mathematics
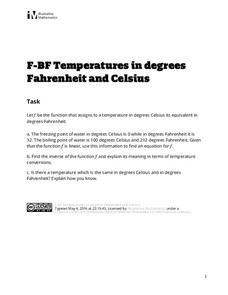
Temperature in Degrees Fahrenheit and Celsius
Scholars develop the conversion formulas between Fahrenheit and Celsius with a task that presents the class with two known temperature equivalents between the two scales. Pupils use those two points to develop the linear conversion...
Illustrative Mathematics
Building an Explicit Quadratic Function by Composition
Use equivalent expressions to reveal information about their graphs. Pupils verify that two quadratic functions are equivalent. By comparing the two expressions, they determine the vertex, the zeros, the y-intercept, and the...
Illustrative Mathematics
Fred's Fun Factory
Spin to win! Individuals calculate the average number of tickets expected based on a probability distribution for the number of tickets per spin. Pupils use that information to determine the average number of tickets that can be won...
Illustrative Mathematics
Invertible or Not?
Two for one—create an invertible and non-invertible function from the same data. The task presents a function table with missing outputs for the class to use to create two functions. One of the functions should have an inverse while the...
Illustrative Mathematics
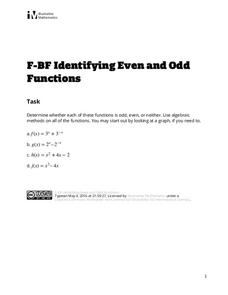
Identifying Even and Odd Functions
Is it even ... or odd? The task provides four functions to identify as being even, odd, or neither. Pupils use algebraic methods to make their decisions with select exponential, quadratic, and cubic functions.
Illustrative Mathematics
Rainfall
Find the how long it has been raining based upon the amount of rainfall. Scholars analyze a table of the amount of rainfall as a function of time. Pupils first determine whether the function is invertible, then they find and interpret...
Illustrative Mathematics
Latitude
The greater the latitude, the less of the Earth is north. Scholars graph the relationship between the latitude and the percentage of the Earth that is north of the latitude. Using the graph and the table, class members interpret values...
Illustrative Mathematics
Temperature Conversions
Complete two conversions at once using compositions. Pupils use the conversion formulas for temperatures to calculate a formula to convert directly between Kelvin and Fahrenheit. Classmates determine the meanings of composition...
Illustrative Mathematics
Households
Use an inverse linear function to interpolate a point. Presented with the number of households over a period of year, pupils find a linear function that will be a model. Class members determine the inverse of the linear function and use...
Illustrative Mathematics
Hours of Daylight 1
The midline of the mathematical model of the number of hours of sunlight is not 12 hours. Pupils use the modeling cycle to determine a function that will model the number of hours of sunlight at a location of their choosing. Using...
Illustrative Mathematics
Foxes and Rabbits 2
The fox population chases the rabbit population. Groups model the populations of foxes and rabbits with two trigonometric functions. Individuals graph both trigonometric models on the same graph, and then teams determine an explanation...
Illustrative Mathematics
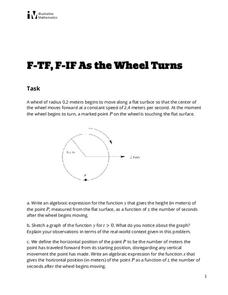
As the Wheel Turns
Determine the location of a point on a moving wheel. The task challenges groups to determine the horizontal and vertical locations of a point on the edge of wheel that is moving. Teams first determine a function that will model the...
Illustrative Mathematics
Carbon 14 Dating in Practice I
How old is the plant? Here is a task that presents the exponential decay function for carbon 14 in a plant. Pupils use the function to estimate the amount of carbon 14 in the plant when it died and analyze the function to find what...
Illustrative Mathematics
Exploring Sinusoidal Functions
What effect does changing a parameter have on the graph of a trigonometric function? Pupils use a Desmos applet to explore the general sine graph. They experiment changing different parameters and record the resulting change of the...
Illustrative Mathematics
Building a General Quadratic Function
Rewrite a quadratic function to easily see the transformations involved. The instructional task takes a general quadratic function and rewrites it into a form that shows the translations and scaling of the parent quadratic function. The...
Illustrative Mathematics
Coordinates of Equilateral Triangles
Can it be constructed? The task poses the question whether it is possible to have an equilateral triangle with its vertices located at integer coordinates. Pupils work with their knowledge of trigonometric ratios and the Pythagorean...
Illustrative Mathematics
Bank Account Balance
Represent the ups and downs of a bank account. The two-part task points out that some types of graphs may better show discrete functions than others. Pupils analyze a graph on how well it represents the situation. They develop their own...
Illustrative Mathematics
Foxes and Rabbits 3
Model periodic populations. Here, in the context of foxes and rabbits, pupils look at graphs of the populations of these animals in a national park over a span of 24 months. Groups analyze the graphs and determine trigonometric...
Illustrative Mathematics
Identifying Quadratic Functions (Vertex Form)
Pupils calculate the equation of a quadratic in vertex form from a specific graph and determine an equation that would fit the description of a parabola. The final question determines the individuals' understanding of the signs of the...


