Curated by
ACT
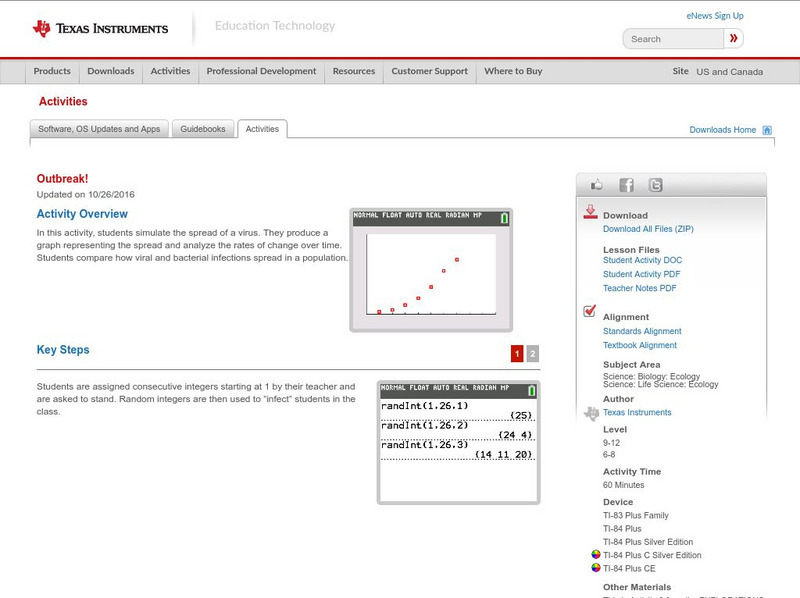
In this activity, students simulate the spread of a virus. They produce a graph representing the spread and analyze the rates of change over time. Students compare how viral and bacterial infections spread in a population.
3 Views
0 Downloads
Additional Tags
Classroom Considerations
- Knovation Readability Score: 3 (1 low difficulty, 5 high difficulty)

