Curated OER
Murder in the First Degree - The Death of Mr. Spud
Secondary learners investigate exponential functions in a real-world scenario. They collect data on the temperature of a cooling baked potato, enter the data into lists, and graph the data using a scatter plot before finding an...
Radford University
Population Project
How fast does it grow? Scholars work on two tasks dealing with exponential growth, one on population growth and the second on investments. Learners research a country's population over the past century and make predictions of the current...
Radford University
Real World Data
Make math class feel more real by using real-world data. Scholars research or collect data on several different topics, such as nutrition, the motion of moving objects, cooling curves, and daylight hours. They create scatter plots using...
Radford University
Are You Faster than Bacteria?
Just how fast does bacteria grow? Over the course of three lessons, pupils investigate exponential growth with the use of bacteria growth. During the lesson, bacteria from a cell phone is grown to make a connection to real life. Using...
Radford University
Earthquake Problem
Shake up things in the classroom. The unit uses earthquakes to bring a real-life connection to finding arc lengths, logarithms, and equations of circles. Small groups determine whether particular towns would have felt an earthquake after...
Radford University
Feeding the World
Using technology, pupils find an exponential function to model the population growth of the US. With more information, learners derive the population growth formula for the world. Ultimately, they determine the amount of protein needed...
Intel
Track the Trends
Allow your classes to research what interests them. An engaging STEM lesson, the fourth in the series of six, asks individuals to choose a topic of interest and analyze the data through regression models. The regression equations allow...
Virginia Department of Education
Exponential Modeling
Investigate exponential growth and decay. A set of six activities has pupils collecting and researching data in a variety of situations involving exponential relationships. They model these situations with exponential functions and solve...
EngageNY
Bean Counting
Why do I have to do bean counting if I'm not going to become an accountant? The 24th installment of a 35-part module has the class conducting experiments using beans to collect data. Learners use exponential functions to model this...
EngageNY
Modeling a Context from Data (part 2)
Forgive me, I regress. Building upon previous modeling activities, the class examines models using the regression function on a graphing calculator. They use the modeling process to interpret the context and to make predictions based...
EngageNY
Modeling an Invasive Species Population
Context makes everything better! Groups use real data to create models and make predictions. Classmates compare an exponential model to a linear model, then consider the real-life implications.
EngageNY
Linear and Exponential Models—Comparing Growth Rates
Does a linear or exponential model fit the data better? Guide your class through an exploration to answer this question. Pupils create an exponential and linear model for a data set and draw conclusions, based on predictions and the...
Firelands Local Schools
Exponential Growth and Decay
How can you safely model exponential growth and decay? A hands-on activity uses candies to model not only exponential decay, but also exponential growth. Exponential equations are fitted by hand and by use of a calculator to the data...
Curated OER
Chill Out
Students investigate Newton’s Law of Cooling. For this Algebra II/ Pre-Calculus lesson, students explore exponential regression as they conduct an experiment to simulate the temperature variations that occur as a liquid cools. The...
Texas Instruments
Texas Instruments: Exponential Regression
In this activity, students perform exponential regression on a data set.
Texas Instruments
Texas Instruments: Now You See It, Now You Don't
In this activity, students study the relationship between age and near point accommodation (NPA). They predict a person's age using NPA distance values. They use exponential regression, create box-and-whisker plots and histograms.
Texas Instruments
Texas Instruments: Exponential Models and Logarithmic Scales
In this activity, students will analyze exponential growth data and then switch to a logarithmic scale. Includes both an exponential and a linear regression on the data, and asks students to make connections between two forms of...
Texas Instruments
Texas Instruments: How High Will It Bounce?
In this activity, students collect the height versus time data of a bouncing ball using the CBR 2. They find the relationship between the bounce number and the bounce height. They learn to graph scatter plots, calculate the maximum value...
Stefan Warner and Steven R. Costenoble
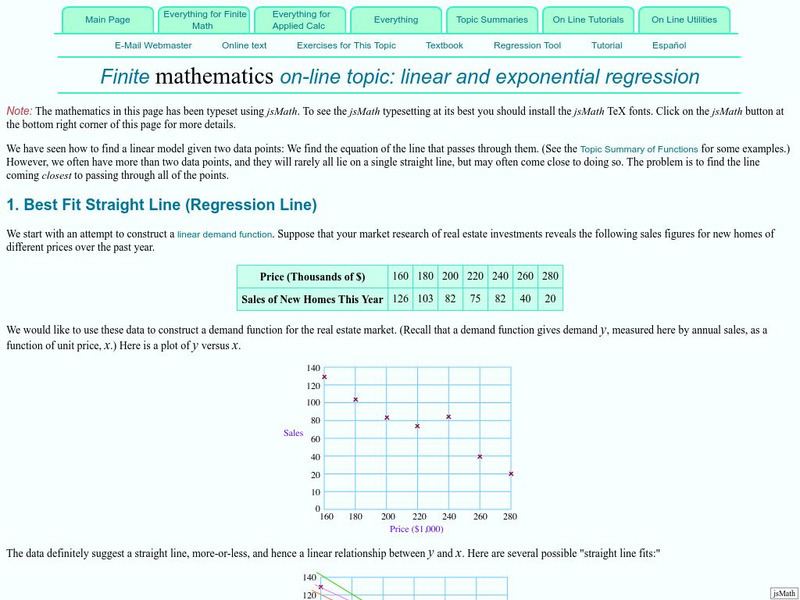
Finite Mathematics & Applied Calculus: Linear and Exponential Regression
Students learn about linear and exponential regression. Class notes, examples, and practice problems are used to investigate the concepts.
CK-12 Foundation
Ck 12: Algebra: Applications of Function Models
[Free Registration/Login may be required to access all resource tools.] In this lesson students draw a scatter plot of data, find and draw the function that best fits that data, and make predictions from that information. Students watch...


