Khan Academy
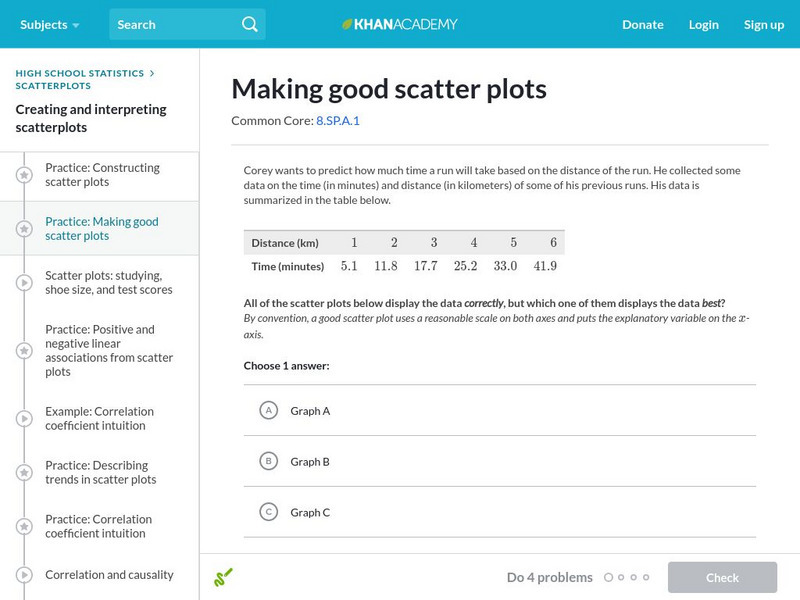
Khan Academy: Making Good Scatter Plots
A good scatter plot has the independent variable on the x-axis and the dependent variable on the y-axis. Also, the scale of both axes should be reasonable, making the data as easy to read as possible. In these practice problems, we...
Illustrative Mathematics
Illustrative Mathematics: S Id.6 Used Subaru Foresters
Help Jane sell her Forrester! Using the data given, students will make an appropriate plot with well-labeled axes that would allow you to see if there is a relationship between price and age and between price and mileage. Students are...
Illustrative Mathematics
Illustrative Mathematics: S Id.7 Used Subaru Foresters
Jane wants to sell her Subaru Forester and does research online to find other cars for sale in her area. She examines the scatterplot of price versus age and determines that a linear model is appropriate. Answer a variety of questions...
Illustrative Mathematics
Illustrative Mathematics: S Id, F if Laptop Battery Charge
This task uses a situation that is familiar to students to solve a problem they probably have all encountered before: How long will it take until an electronic device has a fully charged battery? Given data, students perform a variety of...
Illustrative Mathematics
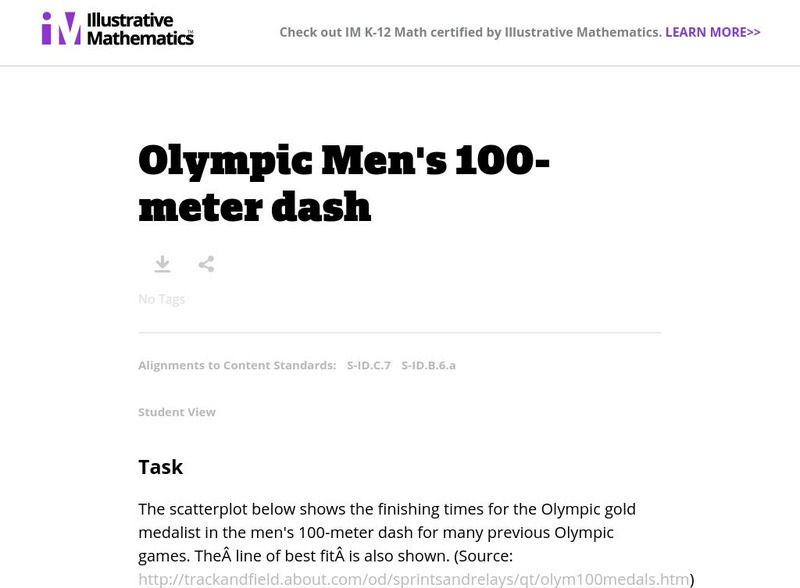
Illustrative Mathematics: S Id.6a,7 Olympic Men's 100 Meter Dash
This task asks students to identify when two quantitative variables show evidence of a linear association and to describe the strength and direction of that association. Students will use a scatterplot showing the finishing times for the...
Illustrative Mathematics
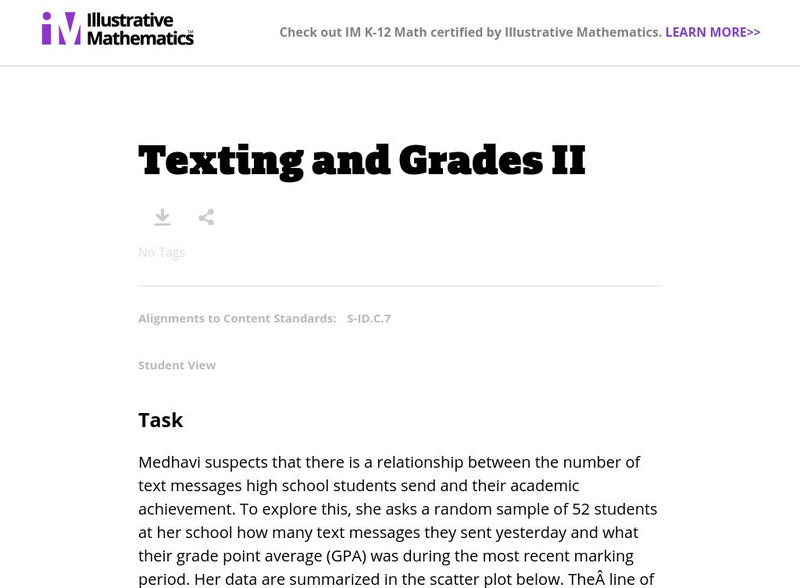
Illustrative Mathematics: S Id.7 Texting and Grades
Medhavi suspects that there is a relationship between the number of text messages high school students send and their academic achievement. To explore this, she asks a random sample of 52 students at her school how many text messages...
Illustrative Mathematics
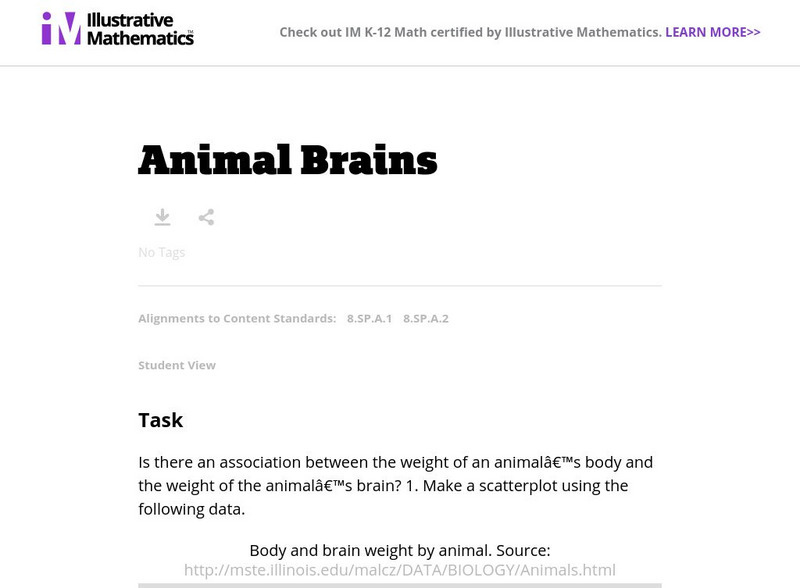
Illustrative Mathematics: 8.sp Animal Brains
This task looks at a possible relationship between the weight of an animal's body and the weight of its brain. Students make a scatter plot of data, look for outliers, make a second scatter plot without the outliers, and describe the...
Illustrative Mathematics
Illustrative Mathematics: 8.sp.1 Hand Span and Height
This task looks at a possible relationship between height and hand size. Students collect data from classmates, make a scatter plot, and explain the relationship as linear or nonlinear. Aligns with 8.SP.A.1.
Illustrative Mathematics
Illustrative Mathematics: 8.sp.1 Texting and Grades I
This task looks at a possible relationship between how many text messages high school students send and their grade point average. The data is presented in a scatter plot which students must examine for patterns and deviations. Aligns...
Illustrative Mathematics
Illustrative Mathematics: 8.sp Birds' Eggs
A scatter plot showing data for the sizes of birds' eggs is presented. Students are to look for correlations and make predictions whose values fall within the data range. They are also to make generalizations about the characteristics of...
Illustrative Mathematics
Illustrative Mathematics: 8.sp Laptop Battery Charge
This task looks at how long it takes for a laptop battery to fully charge. Students make a scatter plot of data, draw a 'line of best fit,' and predict the time it will take to reach a full charge. Aligns with 8.SP.A.2.
CK-12 Foundation
Ck 12: Algebra: Quadratic Functions and Their Graphs
[Free Registration/Login may be required to access all resource tools.] Learn the anatomy of the graph of a quadratic function.
CK-12 Foundation
Ck 12: Statistics: Least Squares Regression
[Free Registration/Login may be required to access all resource tools.] This Concept introduces students to least-squares regression.
CK-12 Foundation
Ck 12: Statistics: Scatter Plots and Linear Correlation
[Free Registration/Login may be required to access all resource tools.] In this tutorial, students learn how to interpret data through the use of a scatter plot.
Alabama Learning Exchange
Alex: My Peanut Butter Is Better Than Yours!
The students will engage in the process of statistical data comparing data using tables and scatterplots. The students will compare data using measures of center (mean and median) and measures of spread (range). This lesson can be done...
Alabama Learning Exchange
Alex: Ballistic Statistics!
Young scholars will collect examples of various statistical instruments and form an electronic scrapbook. These materials will be gathered from electronic sources in addition to periodicals and other print resources.
Alabama Learning Exchange
Alex: How Long Will It Take?
In this lesson, students will participate in a group activity using a sponge ball and a growing human circle. The students will be added to a circle in groups of two and will pass the sponge ball from hand to hand until it returns to the...
Alabama Learning Exchange
Alex: Statistically Thinking
The object of this project is for students to learn how to find univariate and bivariate statistics for sets of data. Also, the students will be able to determine if two sets of data are linearly correlated and to what degree. The...
Shodor Education Foundation
Shodor Interactivate: Scatter Plot
Graph ordered pairs and customize the graph title and axis labels. Points are connected from left to right, rather than being connected in the order they are entered.
Shodor Education Foundation
Shodor Interactivate: Linear Regression and Correlation
Learners are introduced to correlation between two variables and the line of best fit.
Shodor Education Foundation
Shodor Interactivate: Comparison of Univariate and Bivariate Data
Learners learn about the difference between univariate and bivariate data and understand how to choose the best graph to display the data.
Cuemath
Cuemath: Data Handling
This comprehensive guide about data handling helps with understanding how the study of data handling and graphical representation of the data along with other tools help us in dealing with numerical data. Includes solved examples and...
Other
Nearpod: Scatterplots, Correlation & Lines of Best Fit
In this instructional activity on scatterplots, students will learn how to create the line of best fit and analyze scatterplots by learning about correlations and causation.
National Council of Teachers of Mathematics
Nctm: Figure This: Does It Make a Difference Where You Shop?
A math investigation that uses scatter plots to compare prices of favorite soft drinks. Discover how valuable your skills in organizing and displaying data can be in real life scenarios.


