Willow Tree
Midpoint and Distance Formulas
The shortest distance between two points is a straight line. Learners use the Pythagorean Theorem to develop a formula to find that distance. They then find the midpoint using an average formula.
Noyce Foundation
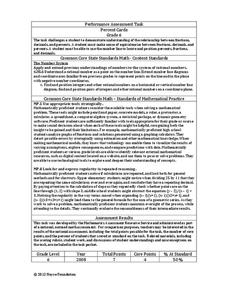
Percent Cards
Explore different representations of numbers. Scholars convert between fractions, decimals, and percents, and then use these conversions to plot the values on a horizontal number line.
Illustrative Mathematics
Walk-a-thon 1
Your mathematician's job is to explore the relationship between hours and miles walked during a walk-a-thon. The activity compels your learners to experiment with different means in finding out this proportional relationship. The answer...
Curated OER
Is This a Rectangle?
How do you show that something is a rectangle? This activity starts with four coordinate points and asks young geometers to explain whether they create a rectangle. Knowledge from both geometry and algebra come into play here, as well...
Inside Mathematics
Functions
A function is like a machine that has an input and an output. Challenge scholars to look at the eight given points and determine the two functions that would fit four of the points each — one is linear and the other non-linear. The...
Curated OER
The Distance and Midpoint Formula
In this college level mathematics worksheet, students solve use the Pythagorean Theorem to find the missing side of a right triangle and explore the connection between the Pythagorean Theorem and the distance formula. Students also...
Curated OER
Bird and Dog Race
Your pupil's pet dog and bird are racing down the city streets. In order to know who is going to win, they better know something about calculating rates, the Pythagorean Theorem, and applying those topics to the map of the city.
PBS
Adding Integers
Your sixth and seventh graders deepen their understanding of a number line and adding integers in this concrete, hands-on activity. Learners play "Warehouse Puzzle" and then discuss their game strategies and the characteristics...
Charleston School District
Graphing Functions
How do letters and numbers create a picture? Scholars learn to create input/output tables to graph functions. They graph both linear and nonlinear functions by creating tables and plotting points.
West Contra Costa Unified School District
Sneaking Up on Slope
Pupils determine the pattern in collinear points in order to determine the next point in a sequence. Using the definition of slope, they practice using the slope formula, and finish the activity with three different ways to determine the...
EngageNY
An Area Formula for Triangles
Use a triangle area formula that works when the height is unknown. The eighth installment in a 16-part series on trigonometry revisits the trigonometric triangle area formula that previously was shown to work with the acute triangles....
EngageNY
Some Facts About Graphs of Linear Equations in Two Variables
Develop another way to find the equation of a line. The instructional activity introduces the procedure to find the equation of a line given two points on the line. Pupils determine the two points from the graph of the line.
Virginia Department of Education
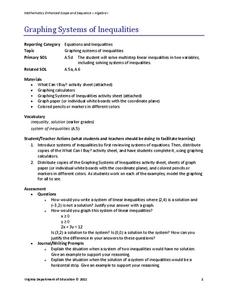
Graphing Systems of Inequalities
Apply systems of inequalities to a real-world problem. Here, scholars learn to graph solutions to systems of linear inequalities. To finish the lesson, they solve a problem involving burgers and cheeseburgers using a system of inequalities.
Achieve
Rabbit Food
Keep your pets slim, trim, and healthy using mathematics! Pupils use a linear programming model to optimize the amount and type of food to provide to a pet rabbit. They model constraints by graphing inequalities and use them to analyze a...
Curated OER
Angles Activities
A series of geometry worksheets have mathematicians constructing, dissecting, overlapping, and measuring as they analyze angles in various contexts. Learners use symmetry and reflections in a compass rose to write instructions on...
Curated OER
Graphing Inequalities in Two Variables
This study guide is a great resource to help you present the steps to graphing linear inequalities. Show your class two different ways to graph an inequality and work on a real-world example together. The document could also be easily...
Illustrative Mathematics
Walk-a-thon 2
During a walk-a-thon your learners must determine the walking rate of Julianna's progress. Using tables, graphs, and an equation, they must be able to calculate the time it took her to walk one mile and predict her distance based on the...
EngageNY
Criterion for Perpendicularity
The Pythagorean Theorem is a geometry pupil's best friend! Learners explain the equation a1b1 + a2b2 = 0 for perpendicular segments using the Pythagorean Theorem. They are able to identify perpendicular segments using their endpoints and...
EngageNY
Motion Along a Line – Search Robots Again
We can mathematically model the path of a robot. Learners use parametric equations to find the location of a robot at a given time. They compare the paths of multiple robots looking for parallel and perpendicular relationships and...
EngageNY
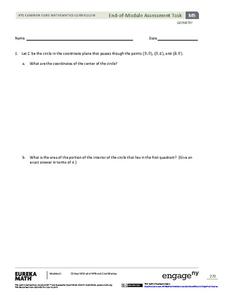
Geometry Module 5: End-of-Module Assessment
The lessons are complete. Learners take an end-of-module assessment in the last installment of a 23-part module. Questions contain multiple parts, each assessing different aspects of the module.
Inside Mathematics
Graphs (2006)
When told to describe a line, do your pupils list its color, length, and which side is high or low? Use a worksheet that engages scholars to properly label line graphs. It then requests two applied reasoning answers.
EngageNY
Geometric Interpretations of the Solutions of a Linear System
An intersection is more than just the point where lines intersect; explain this and the meaning of the intersection to your class. The 26th segment in a 33-part series uses graphing to solve systems of equations. Pupils graph linear...
Curated OER
Data Collection and Presentation
Middle and high schoolers collect and analyze data from four different activities. The activities include information about classmates, tallying colors of cars in a parking lot, stem and leaf plots, and making a histogram from winning...
Teach Engineering
Can You Resist This?
Some things are hard to resist. Small collaborative groups build circuits and calculate the voltage using Ohm's Law. Budding engineers explore the connection between the voltage across different resistors and linear functions with...
Other popular searches
- Graphing Coordinate Planes
- Plotting Coordinate Planes
- Christmas Coordinate Planes
- Coordinate Planes Math
- Coordinate Planes Worksheets
- Coordinate Planes Blank
- Graph Coordinate Planes
- Ed Helper Coordinate Planes
- Coordinate Planes Line Graph
- Coordinate Planes Math Free


