EngageNY
Modeling a Context from Data (part 2)
Forgive me, I regress. Building upon previous modeling activities, the class examines models using the regression function on a graphing calculator. They use the modeling process to interpret the context and to make predictions based...
Curated OER
Conductivity - Pass the Buoy and Pepper, Please
Buoys around our coastlines are equipped with sensory devices which monitor temperature, salinity, and water pressure. Emerging earth scientists examine some of this data and relate salinity to the electrical conductivity of the surface...
Centers for Disease Control and Prevention
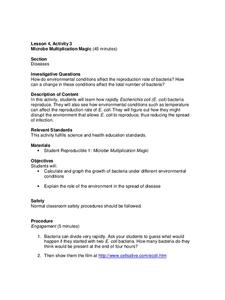
Microbe Multiplication Magic
A lesson introduces the reproduction rate of E. coli though a video. Then scholars complete a data table and graph of reproduction rates in ideal conditions as well as less than ideal conditions.
Royal Society of Chemistry
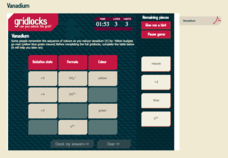
Vanadium
Introduce your chemistry scholars to the periodic table's Goddess of Beauty! Through an interactive that highlights the transition metal vanadium, learners discover the colors produced in solution as vanadium changes oxidation state....
Concord Consortium
Broken Spreadsheet I
There is power in spreadsheet formulas and learners use this power to model quadratic data. Given a scatterplot of a parabola, pupils create formulas in a spreadsheet to populate the data. The formulas they use lead to an understanding...
Pingry School
Comparing Activities of Selected Metals
Don't overreact! A simple experiment demonstrates chemical reactions as scholars mix chemical solutions and metals in a large well plate. They note all changes to the metals, solutions, precipitate, colors, and more. A full data table...
Pingry School
Gas Pressure and Volume Relationship
Do your high school scientists know the four methods scientists use to communicate information? A simple experiment discovering the relationship between gas pressure and volume allows pupils to practice all four. After completing the...
Mathematics Assessment Project
College and Career Readiness Mathematics Test C1
Challenge high schoolers with a thorough math resource. The 20-page test incorporates questions from upper-level high school math in applied and higher order questions.
Pingry School
Solubility Product of an Ionic Compound
How do scientists determine when a solution is fully saturated? Scholars address the topic as they observe patterns of precipitation in various concentrations of ions. Using a well plate, pipette, and common chemicals, they collect data...
Pingry School
Replacement of Hydrogen by a Metal
As the most abundant element on the earth, hydrogen requires no replacement. Yet scholars learn to replace hydrogen with a metal to liberate the hydrogen gas. A simple procedure and data table include the necessary information and...
Curated OER
Activity: An Experiment with Dice
Roll the dice with this activity and teach young mathematicians about probability. Record outcomes for rolling two number cubes in order to determine what is most likely to happen. Graph the data and investigate patterns in the results,...
CK-12 Foundation
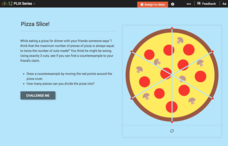
Using Quadratic Equations to Solve Problems: Pizza Slice!
Get the most out of a pizza. Class members use an interactive to simulate cutting a pizza to determine the maximum number of slices possible. The pupils create a set of data points and determine the equation that models the relationship.
Rensselaer Polytechnic Institute
Molecules to the Max!—Educators Resource Guide
From molecules to nanotubes, an engaging unit explores the world of tiny science. Fifteen hands-on experiments and lessons engage young scientists as they learn chemistry. Discussions, worksheets, and data analysis reinforce the concepts...
University of North Carolina
Statistics
Let's see you back it up! As shown in the 18th handout in the Writing the Paper series of 24 lessons from UNC, statistics help form an effective argument. The handout discusses how to analyze a source and break down the data to ensure it...
College Board
2017 AP® Statistics Free-Response Questions
Reduce testing anxiety by helping learners prepare for test day. Scholars complete six free-response questions from a released AP® exam. The questions test a variety of concepts including confidence intervals, frequency tables,...
US Department of Commerce
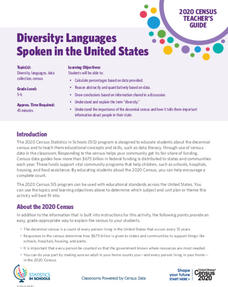
Diversity: Languages Spoken in the United States
High schoolers begin a discussion on diversity and determine the percent of the population that speak another language at home in the US. Classmates make a prediction of the percentage of people that speak another language at home in...
Curated OER
Data Days
Sixth graders practice collecting, organizing and displaying data. They create circle, bar, line and picto graphs. They analyze data in small and large sample groups.
Curated OER
Graphing Fun In Third Grade
Third graders display information in a graph, table, and chart. In this data lesson plan, 3rd graders look at graphs, tables, and charts, discuss their importance, and make their own.
Curated OER
Catches and landed value of fish
Students analyze data. In this secondary mathematics lesson, students read and retrieve data from a statistical table on the Canadian fishing industry. Students interpret and describe data in mathematical terms and make inferences and...
Curated OER
ou are the Researcher!
Students conduct a census at school. They collect data, tally it, and create a frequency table. Students display their data in three different types of graphs. They write complete sentences describing the graph.
Curated OER
Using Diagrams in Problem Solutions
Students use tables, graphs and diagrams to collect data. In this problem solving with diagrams lesson plan, students construct their own tables and graphs containing information they gather from a drawing. They also make a Venn Diagram...
Curated OER
Bouncy Ball Collections
In this data table instructional activity, students examine a table regarding bouncy ball data and respond to 4 questions regarding the data.
Curated OER
Bar Graphs
Seventh graders visually represent and analyze data using a frequency table. They recognize what values in a data set are bigger by looking at a bar graph and answer questions about certain bar graphs and what they represent. Students...
Curated OER
Chinese Immigrants in British Columbia, 1870
Students interpret historical evidence presented in primary and secondary resources. In this British Columbia history lesson, students read and analyze data regarding 1870 Canadian census data. Students...


