Curated OER
Creating a PowerPoint Displaying Respectful Behavior
Respect is vital to every relationship and every classroom. Here you will find a resource which will help your pupils to create a multimedia presentation on the topic of respect. They relate their personal behavior and experiences with...
EngageNY
Displaying a Data Distribution
Pupils analyze a display of data and review dot plots to make general observations about the highest, lowest, common, and the center of the data. To finish, learners match dot plots to scenarios.
EngageNY
Editing Sentences and Creating Visual and Multimedia Displays for a Presentation
Let's get visual. Pupils plan visual displays to accompany their upcoming opinion speech presentations. Additionally, they practice editing sentences for clarity before revising their speech drafts.
Institute of Electrical and Electronics Engineers
Statue Display Tower
Sometimes engineering problems that seem easy prove to be more challenging than imagined. Present your class with the challenge to build a functional display tower to support a statue using only the supplies available in class while...
Curated OER
The Common Core Literacy Standards - Grade 1 Posters
Prepare your first grade classroom for the Common Core with this series of colorful literacy standard displays. Providing children with clear learning objectives throughout the school year, this resource includes each English language...
Curated OER
The Common Core Literacy Standards - Grade 3 Posters
Brighten your third grade classroom with this series of colorful Common Core displays. Including all of the English Language Arts standards and substandards, each with supporting illustrations and examples, this resource provides clear...
National Security Agency
Line Plots: Frogs in Flight
Have a hopping good time teaching your class how to collect and graph data with this fun activity-based lesson plan series. Using the provided data taken from a frog jumping contest, children first work...
Carolina K-12
Public Christmas Displays and Lynch v. Donnelly
Does a Christmas display on government property violate the Constitution? Learners study the Establishment Clause of the First Amendment and learn about the landmark Supreme Court case Lynch v. Donnelly through watching a...
CK-12 Foundation
Displaying Categorical Variables: Spending Habits
Bar or circle graph—which is best? Given a circle graph and a total amount of money earned, pupils calculate the amount of money in each category. Learners use the calculated amounts to create a bar graph and compare the two displays.
CK-12 Foundation
Displaying Univariate Data: Ordering Leaves
Leaf a little time to organize data. Given data displayed in a stem-and-leaf plot, learners organize the data in a list. Pupils use the data to determine the mode, median, and range of the data set. They determine the benefits of using a...
Under the Dome
Olympic Display
Design it with soda cases. After viewing a picture of a soda case display, pupils develop questions about the design using information from the teacher. Scholars use the information and their knowledge about area and multiplication to...
West Contra Costa Unified School District
Comparing Data Displays
There is so much more to data than just numbers, and this resource has learners use three methods of comparing data in a multi-faceted instructional activity. The 21-page packet includes a warm-up, examples, an activity, and...
EngageNY
Including Multimedia and Visual Displays in Presentations: Prioritization of Relief Aid after Natural Disasters
It's time to put the plan into practice. Using their plans from the previous instructional activity, scholars create multimedia and visual displays for their opinion speeches. Next, they watch videos of speeches and use a presentation...
Teachers Development Group
Habits of Mind Interaction Posters
From generalizing and justifying to megacognition reflection and perseverance, keep the 16 Habits of Mind as part of an ongoing and developing conversation in your class by displaying these posters around your room throughout...
101 Questions
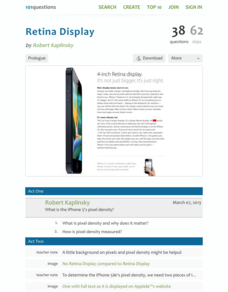
Retina Display
Learners calculate the pixel density of a specific cell phone using the concept of similarity. They use information from the cell phone's website to make their calculations and then compare their results to the posted information.
Ed Galaxy
What is a Scientist? Classroom Poster
Awaken the young scientist in your students with this classroom display. Complete with a variety of science-related verbs, this poster will help guide learners as they explore the world around them.
CK-12 Foundation
Frequency Tables to Organize and Display Data: Favorite Films
What information can your class determine if they know the number of people attending movie showings? Using the information about the number of people at each screening, learners develop a frequency table. The pupils analyze the type of...
Curated OER
Mapping Your Identity: A Back-To-School Ice Breaker
Identify the unique personal attributes of your class members. Begin by viewing the Visual Thesaurus and discussing displayed attributes associated with famous American leaders. Using these identity maps as models, pupils generate nouns...
Curated OER
Playing With Science
Young scientists investigate the scientific concepts and principles that help make common toys such as hula hoops, yo-yos, slinkies, and silly putty work. As a class, they read "Backyard Rocket Science, Served Wet" to get a look behind...
Curated OER
The Common Core Literacy Standards - Grade 2 Posters
Support second graders with mastering the Common Core using this series of classroom displays. With each English language arts standard rewritten as a We can statement and accompanied by images and examples, this resource provides...
EngageNY
Describing a Distribution Displayed in a Histogram
The shape of the histogram is also relative. Learners calculate relative frequencies from frequency tables and create relative frequency histograms. The scholars compare the histograms made from frequencies to those made from relative...
Code.org
Making Data Visualizations
Relax ... now visualize the data. Introduce pupils to creating charts from a single data set. Using chart tools included in spreadsheet programs class members create data visualizations that display data. The...
Mathed Up!
Stem and Leaf Diagrams
Order the data within a stem-and-leaf display. Pupils take data and create and ordered stem-and-leaf diagrams, including the key. Participants take their data and determine answers about the information. Class members then find...
CK-12 Foundation
Double Bar Graphs: Favorite Cookies Chart
It's just the way the cookie crumbles. Using the data from a class poll, learners create a double bar graph showing favorite cookie types. The pupils compare favorites between boys and girls with the aid of their graphs, then they make...
Other popular searches
- Multiplication Displays
- Analyze Data Displays
- Card Displays
- Product Displays
- Analyzing Data Displays
- Comparing Data Displays
- Artistic Design in Displays
- Math Displays
- Displays for Autumn
- Visual Displays
- Art Displays
- Hallway Displays


