Curated OER
Raising the Bar While Hogging the Ham (Radio That Is)
Learners create a bar graph that communicates an amount without the need to know the exact data, determine what scale to use to best represent the data and use their bar graph to persuade others.
Curated OER
Surveying During a Basketball Game
Tenth graders conduct a survey at a high school basketball game. They compile and present the data as histograms or bar graphs.
Curated OER
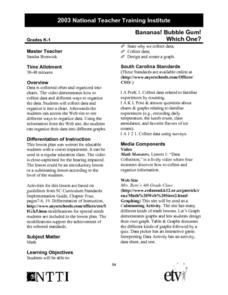
Bananas! Bubble Gum! Which One?
Students design and create a graph of data they have collected on their favorite candy bars. They explore how to organize data as well.
Curated OER
Sweethearts and Data Analysis
Middle schoolers explore the concept collecting and representing data. In this collecting and representing data lesson, students record the different colors of sweetheart candies in their sweethearts box. Middle schoolers create a table...
Curated OER
Valentine's Day Math
First graders explore sorting and classifying. In this math lesson, 1st graders sort conversation hearts based on color. Students graph their results and enjoy the candy!
Curated OER
Math, Sweet Math Activity Sheet
In this candy graphing worksheet, 1st graders will place candy on their paper to create a bar graph. They will answer several questions based on their data. A teacher checklist is provided.
Curated OER
Edible Math
Second graders use M&M candies to graph colors, illustrate story problems and practice hands-on math. They use spreadsheets, worksheets and graphs to organize math problems that use M&M's.
Curated OER
"M&Ms"® Candies Worksheet 1
In this math worksheet, students find the likelihood of different outcomes with the use of M and M's candy for the seven questions and fill in the graphic organizer.
Curated OER
Collecting Data and Graphing
Eighth graders, in groups, count the different colors of M&M's in each kind of package and then draw a pictograph to show the results. Each group writes a program to show their results and then compare the manually-drawn and computer...
Curated OER
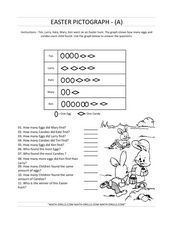
Easter Pictograph
In this pictograph worksheet, students look at the Easter pictograph and solve problems based on the graph. Students complete 10 problems.
Curated OER
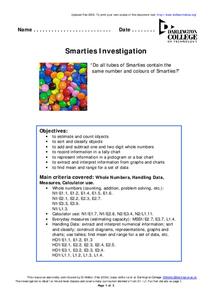
Smarties Investigation
In this math instructional activity, students participate in an investigation of Smarties candy. For example, students estimate how many candies they have in each color, count the actual number, and record the information in a tally chart.
Curated OER
Halloween Graphitti
Learners complete multi-curricular activities in a Halloween themed lesson. In this Halloween lesson, students examine newspaper ads to find prices of pumpkins and use them to complete a stem and leaf plot. Learners find the diameter,...
Curated OER
Mr. Funny Bones Math
In this Mr. Funny Bones math worksheet, learners count the total number of candy bones, sort them into five categories, and graph the number of each kind. Students graph five groups of bones.
Curated OER
Statistics and Probablility
Statistics and Probability are all about collecting, organizing, and interpreting data. Young learners use previously collected data and construct a picture graph of the data on poster board. This stellar activity should lead to...
Curated OER
Sorting Sweethearts
In this holiday worksheet, students estimate how many heart candies are in a cup. Then, students sort their hearts and add up how many are in each color and how many there are total. Students also create a bar graph that displays how...
Teach Engineering
Exploring Variables While Testing and Improving Mint-Mobiles (for High School)
Mint candies are good for more than just one's breath. Using basic materials such as mint candies, straws, index cards, and Popsicle sticks, scholars create race cars that meet a given budget as well as design constraints. They perform...
Curated OER
Mars Landing Site
Students, through the use of candy bars at room temperature, explore the problems selecting a landing site on Mars.
Curated OER
Statistics with M&Ms
Seventh graders explore estimation, measurement, and probability. Students conduct surveys and create charts & graphs. They study the history of chocolate. Students design their own magazine advertisement or create a script for a...
Curated OER
From There To Here...
Students find out where some of the products in hour homes come from, then become aware of our local trash, landfills and incinerators. They chart and graph data and use maps for different purposes.
Curated OER
Inherited Traits
Students work with a partner to complete an inventory of their traits and compare and discuss their unique qualities. In this biology lesson, students determine percentages for the frequency of observed traits of classmates, compile the...
Curated OER
Random Probability
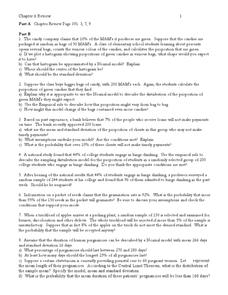
In this statistics and probability worksheet, young statisticians solve and complete 13 different problems related to probability, percentages, and normal distributions. They consider data models, assumptions about the models, and find...
Charleston School District
Pre-Test Unit 6: Systems
As if solving equations with an x isn't tricky enough, now they add a y, too? A pre-assessment gauges the knowledge of your classes related to systems. They are asked to solve graphically and algebraically and to solve word problems.
Curated OER
Probability or Ability?
Pupils use their non-dominant hand to catch candy which they tossed in the air. They estimate how many they catch in a second round. They record and determine how the probability changed the second time.
Curated OER
Our Favourite Halloween Treat
Students conduct a survey about Halloween candy and create a bar graph illustrating the data. In this data analysis activity, stud nets are introduced to the topic with a discussion and survey, then the class creates a large graph and...
Other popular searches
- Halloween Candy Graphing
- Candy Sorting and Graphing
- Graphing Candy Corn
- Graphing Candy Hearts
- Math Graphing Candy Canes
- Candy Graphing
- Aims Candy Graphing
- Coordinate Graphing Candy
- Data Graphing Candy
- Candy Heart Graphing


