Curated OER
A Tasty Solution
In this solutions worksheet, students complete a three step procedure and record the dissolving time of candy. Using their data they create a graph and answer 4 analysis questions.
Curated OER
Technobiz
Learners examine candy preferences to create a plan in order to improve candy sales. In this technobiz lesson, students build spreadsheet and organizational skills by graphing and calculating data. Learners are introduced to terminology...
Curated OER
Cartesian Coordinates
Students investigate rational numbers through data analysis and statistics. For this algebra lesson, students represent, rename, compare and order rational numbers. They collect and represent data correctly on a graph.
Curated OER
Exponential Decay
Young scholars study exponential decay and its application to radiocarbon dating. In this exponential decay lesson, students use candy to model the time it takes for something to decay. Young scholars also graph the data they collect and...
Curated OER
Collect Data Using a Transect Line
Learners learn about transect lines through a study of marine debris. In this marine debris lesson, students calculate the items on a transect line and graph them. Learners complete a category worksheet.
Curated OER
I Can't Take the Pressure!
Students explore the concept of air pressure. Using candy or cookie wafers to model how air pressure changes with altitude, they conduct an aluminum can crushing experiment, compare the magnitude to gravitational force per unit area,...
Curated OER
What's the Fizz Factor
Learners as a class create a fountain using both coke soda, and mentos candy. In this science lesson, students test which combination of coke and mentos products produce the tallest fountain. Learners use the scientific method to track...
Curated OER
RIP M&M's
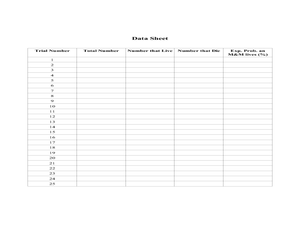
Young scholars solve theoretical probability problems. In this algebra lesson, students apply the concept of probabilities to solving real life scenarios. They collect data and graph it using experimental probability.
Curated OER
Inequalitities Mixed Review
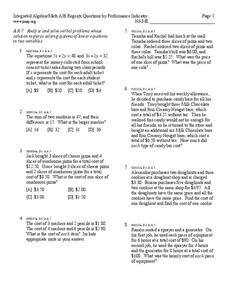
Students solve inequalities and graph it on a number line. In this algebra lesson, students rewrite word problems into algebraic equations and graph it using compound inequalities.
Curated OER
A Recipe for Air
Students create a pie graph using M&Ms to demonstrate the composition of air. They label each section of the graph, and list the fractions from largest to smallest.
Curated OER
Marketing Occupations
Students identify and explain the variables effecting supply and demand in the marketing industry. Then they define the terms supply and demand and graph supply and demand curves on a standard grid. Students also formulate what happens...
Curated OER
Linear Equations
In this algebra worksheet, students solve linear equations and graph their answer. They add and subtract integers and compare them using a number line. There are 15 questions with an answer key.
Curated OER
The Jellybeans and the Big Dance
Enchant your youngsters by reading them The Jellybeans and the Big Dance, by Laura Numeroff and Nate Evans. Ask them to name objects that begin with the letter J like jellybeans. Give each of them some jellybeans to sort by color. They...
Virginia Department of Education
Average Atomic Masses
Facilitate learning by using small objects to teach the principles of atomic mass in your science class. Pupils determine the average mass of varying beans as they perform a series of competitive experiments. They gather data and...
Curated OER
The M&M's Brand Chocolate Candies Counting Book
First graders use estimation skills and gather data and record their findings
Curated OER
A Bar of Many Colors
Second graders use colored candies to collect data, construct double bar graphs, and find averages.
Curated OER
M&M Math
Young scholars sort a bag of M&M candies according to color using a sorting mat. They count M&M candies. They compare the number to their prediction then students create tally charts.
Curated OER
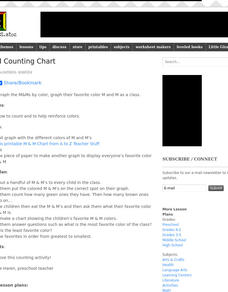
M & M Counting Chart
Students create an individual M&M's graph based on the number of each color of candy pieces in their handful of candy. They graph the favorite color of the whole class while practicing counting and color identification.
Curated OER
Probability
Fourth graders perform probability experiments. In this math lesson, 4th graders complete a penny toss to evaluate and graph the combinations of outcomes. In a second activity, students draw M&Ms out of a bag and graph results. In a...
Curated OER
Get a Half-life!
Students use m&m candies as their sample set. They begin by counting the total number of candies to determine their sample size. Students put the candies into a cup and shake them gently before pouring them onto a paper plate. Count...
Curated OER
Writing Linear Equations
In this math activity, middle schoolers write the equations in slope intercept form for the equations that are graphed. They also create equations using slope and intercepts.
Curated OER
Junk Food Math
Students use Skittles candies as they explore estimation and percentages. In this math lesson plan, students sort, count, and chart Skittles candies to learn about estimation and study percentages.
Curated OER
M & Ms in a Bag
Students make predictions about the number and colors of M&M's in a snack size package. They create an Excel spreadsheet to record the data from their small group's bag, create a graph of the data, and discuss the variations of data...
Curated OER
Taste the Rainbow
Students practice estimating and graphing by utilizing Skittles. In this statistics lesson, students complete worksheets based on the likelihood of a certain color of skittle coming out of the bag. Students create a graph based on the...
Other popular searches
- Halloween Candy Graphing
- Candy Sorting and Graphing
- Graphing Candy Corn
- Graphing Candy Hearts
- Math Graphing Candy Canes
- Candy Graphing
- Aims Candy Graphing
- Coordinate Graphing Candy
- Data Graphing Candy
- Candy Heart Graphing


