Illustrative Mathematics
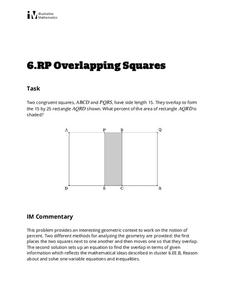
Overlapping Squares
The objective of this activity is to find the percent of the area of a two squares overlapping. Mathematicians find the ratio of area for the part that overlaps to the rectangle formed. The final answer is a percent as a rate per 100....
Mathematics Assessment Project
Solving Problems with Circles and Triangles
After completing a task involving examining the ratio of areas of triangles and circles in a given figure, scholars examine sample responses to identify other strategies they could use to solve the problem.
Noyce Foundation
Parallelogram
Parallelograms are pairs of triangles all the way around. Pupils measure to determine the area and perimeter of a parallelogram. They then find the area of the tirangles formed by drawing a diagonal of the parallelogram and compare their...
Mathematics Assessment Project
Inscribing and Circumscribing Right Triangles
High schoolers attempt an assessment task requiring them to find the radii of inscribed and circumscribed circles of a right triangle with given dimensions. They then evaluate provided sample responses to consider how to improve their...
Inside Mathematics
Sorting Functions
Graph A goes with equation C, but table B. The short assessment task requires class members to match graphs with their corresponding tables, equations, and verbalized rules. Pupils then provide explanations on the process they used to...
Mathematics Assessment Project
Discovering the Pythagorean Theorem
Young mathematicians join the ancient order of the Pythagoreans by completing an assessment task that asks them to find the area of tilted squares on dot paper. They then look at patterns in the squares to develop the Pythagorean Theorem.
Statistics Education Web
Sampling in Archaeology
Compare different random sampling types using an archaeological setting. Scholars collect data from an archaeological plot using simple random samples, stratified random samples, systematic random samples, and cluster random samples....
Noyce Foundation
Building Blocks
Building blocks have more uses than simply entertaining children. Young mathematicians calculate the volume of a given cube, and then calculate the volume and surface area of a prism formed from multiple cubes.
Inside Mathematics
Snakes
Get a line on the snakes. The assessment task requires the class to determine the species of unknown snakes based upon collected data. Individuals analyze two scatter plots and determine the most likely species for five additional data...
American Statistical Association
An A-MAZE-ING Comparison
Teach your class how to use descriptive statistics through a hands-on data collection activity. Pupils collect their own data, calculate test statistics, and interpret the results in context. They compare male and female results, looking...
American Statistical Association
Colors Challenge!
Does writing the name of a color in a different colored ink affect one's ability to read it? Scholars design an experiment to answer this question. They collect the data, analyze the statistics, and draw a conclusion based on what they...
Statistics Education Web
How High Can You Jump?
How high can your pupils jump? Learners design an experiment to answer this question. After collecting the data, they create box plots and scatter plots to analyze the data. To finish the lesson plan, they use the data to draw conclusions.
Statistics Education Web
Using Dice to Introduce Sampling Distributions
Investigate the meaning of a sample proportion using this hands-on activity. Scholars collect data and realize that the larger the sample size the more closely the data resembles a normal distribution. They compare the sample proportion...
Statistics Education Web
It’s Elemental! Sampling from the Periodic Table
How random is random? Demonstrate the different random sampling methods using a hands-on activity. Pupils use various sampling techniques to choose a random sample of elements from the periodic table. They use the different samples to...
Statistics Education Web
Consuming Cola
Caffeine affects your heart rate — or does it? Learners study experimental design while conducting their own experiment. They collect heart rate data after drinking a caffeinated beverage, create a box plot, and draw conclusions. They...
Statistics Education Web
Saga of Survival (Using Data about Donner Party to Illustrate Descriptive Statistics)
What did gender have to do with the survival rates of the Donner Party? Using comparative box plots, classes compare the ages of the survivors and nonsurvivors. Using the same method, individuals make conclusions about the gender and...
Mathematics Vision Project
Circles: A Geometric Perspective
Circles are the foundation of many geometric concepts and extensions - a point that is thoroughly driven home in this extensive unit. Fundamental properties of circles are investigated (including sector area, angle measure, and...
Mathematics Vision Project
Module 6: Congruence, Construction, and Proof
Trace the links between a variety of math concepts in this far-reaching unit. Ideas that seem very different on the outset (like the distance formula and rigid transformations) come together in very natural and logical ways. This unit...
K12 Reader
Basic Geometry Terms
Set your pupils up to start on geometry by teaching them some introductory terminology. Pupils learn the terms by reading a short passage and looking at examples. They then respond to five questions related to the text.
Shodor Education Foundation
An Introduction To Quadrilaterals
Young geometers investigate and apply properties of quadrilaterals. After a review and discussion of key terms, students use a computer applet to explore four-sided figures and classify them according to their attributes. The...
Statistics Education Web
Are Female Hurricanes Deadlier than Male Hurricanes?
The battle of the sexes? Scholars first examine data on hurricane-related deaths and create graphical displays. They then use the data and displays to consider whether hurricanes with female names result in more deaths than hurricanes...
Howard County Schools
Factoring Trinomials Using Tiles
What's the opposite of multiplying binomials? Learners apply their previous knowledge of multiplying binomials using algebra tiles to factor trinomials. The lesson introduces factoring as a process that uses algebra tiles to...
California Education Partners
Tile Mural
Paste this resource into your lesson plans like you'd paste a tile onto a mural. Given a diagram of a tile mural with rectilinear figures, future artists determine the perimeters and areas of the figures. They must then develop their own...
Alabama Learning Exchange
How Old is Your Money?
Elementary learners explore coin mint dates. First, they listen to the book Alexander Who Used to be Rich Last Sunday by Judith Viorst. They then sort a collection of coins according to their mint date and put them in order from oldest...


