EngageNY
Computing Actual Lengths from a Scale Drawing
The original drawing is eight units — how big is the scale drawing? Classmates determine the scale percent between a scale drawing and an object to calculate the length of a portion of the object. They use the percent equation to find...
EngageNY
An Exercise in Creating a Scale Drawing
Design your dream classroom. The lesson plan contains an exercise to have teams create a scale drawing of their dream classroom. Pairs take the measurements of their classroom and furniture and create a scale factor for them. To finish...
EngageNY
Solving Area Problems Using Scale Drawings
Calculate the areas of scale drawings until a more efficient method emerges. Pupils find the relationship between the scale factor of a scale drawing and the scale of the areas. They determine the scale of the areas is the square of the...
Curated OER
Scale Drawings of Birds
Students create their own copies of Phoenix Birds using a grid system.
Corbett Maths
Enlargements Using Ray Method
Figure out what to do when there is no grid to count. Using a ruler and a sharp pencil, the narrator shows how to perform a dilation when the figure is not on a grid. The ray method works by drawing a ray from the center of dilation...
Curated OER
Scaled Measurements
Introduce youngsters to the concept of scale measurement and the uses of scale drawing. They are provided with an explanation and then given two examples of how scale measurements work. This would be a good resource to use prior to...
Curated OER
Draw an Inch, Walk a Mile
Students work in small groups to solve the problems presented. The main project, mapping the classroom, use these discussions to collaborate in creating a tangible demonstration of their understanding.
Scientific American
Life-Sized Drawing
Ocean explorers or mathematicians research the wreck of the CSS H.L. Hunley. They investigate the actual dimensions of the Hunley using math and measuring skills. Afterward, they sketch a large scale drawing of the submarine outdoors on...
National Wildlife Federation
Quantifying Land Changes Over Time Using Landsat
"Humans have become a geologic agent comparable to erosion and [volcanic] eruptions ..." Paul J. Crutzen, a Nobel Prize-winning atmospheric chemist. Using Landsat imagery, scholars create a grid showing land use type, such as urban,...
Curated OER
Footprints: Take a Step into Estimation
Compare sizes of student footprints with those of elephants and sauropod dinosaurs! Upper graders make estimations of the areas of irregular shapes; students use grids to make and explain estimates within low and high ranges.
EngageNY
Drawing the Coordinate Plane and Points on the Plane
To plot a point in the coordinate plane, you first need a coordinate plane. Pupils learn to draw an appropriate set of axes with labels on a coordinate plane. They must also determine a reasonable scale to plot given coordinate pairs on...
Curated OER
Mapping the Bone Field: An Area and Scale Exercise
Here is an excellent cross-curricular lesson. Learners relate multiplication to area by making a grid on graph paper, and then creating the same grid in real space outside in the school yard.
Edgate
Great Grids
Learners use grid boxes as a measurement tool and discover how grids are used for mapmaking and scaling down an area. They begin by attempting to draw a model shape drawn by the teacher by using the gridding process. At the conclusion of...
Achieve
Framing a House
If members of your class wonder where they can use the math they learn in middle school, let them discover the answer. Learners apply geometry concepts of scale and measure to calculate the costs of framing a house addition.
Curated OER
Ocean Scale Drawing
Students explain how to make pictures larger using a grid system by transferring scales images from 1/2 -1 inch to 6 inches - 1 foot. They create life-size scale drawings of ocean life studied in class using a grid system.
Curated OER
Rainbow Fish Drawing
First graders read the book, RAINBOW FISH and view a few pictures of different types of fish. They discuss putting certain shapes together make up objects and talk about and demonstrate straight and wavy lines, thick and thin lines....
Curated OER
Shattered Images Value Study
Young scholars create cubist drawings using grids and enlargement.
Achieve
Fences
Pupils design a fence for a backyard pool. Scholars develop a fence design based on given constraints, determine the amount of material they need, and calculate the cost of the project.
Curated OER
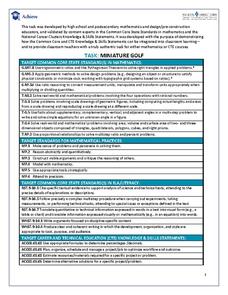
Task: Miniature Golf
"Fore!" All right, no one really yells this out in miniature golf, but this well-defined activity will have your charges using lots of numbers in their unique design of a miniature golf hole. Included in the activity criteria is the...
Achieve
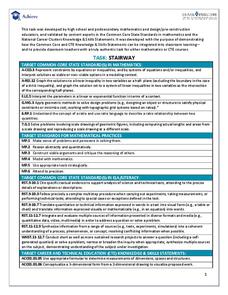
Stairway
It's the stairway to learning! Scholars research all aspects of building a staircase. Using information from building codes, they write and graph a system of inequalities to analyze the constraints. The completed project is a scale model...
Statistics Education Web
It Creeps. It Crawls. Watch Out For The Blob!
How do you find the area of an irregular shape? Class members calculate the area of an irregular shape by finding the area of a random sampling of the shape. Individuals then utilize a confidence interval to improve accuracy and use a...
Bytes Arithmetic
Geometry Pad+
Graphing paper, pencil, ruler, protractor, and compass, all get replaced or supplemented with this dynamic geometry application. Here, you can create, move, and scale many different shapes, as well as, explore and change their properties...
Curated OER
Grid it, Map it
Students participate in designing a city layout using grids and coordinates. They work on a city space and create a grid on a life size layout on the gym floor.
abcteach
Street Mapping
What's around the block? Or down the street? Ask your pupils to tap into their map skills by drafting the area around their home and school.


