Mathematics Assessment Project
Generalizing Patterns: Table Tiles
As part of a study of geometric patterns, scholars complete an assessment task determining the number of tiles needed to cover a tabletop. They then evaluate provided sample responses to see different ways to solve the same problems.
National Museum of Nuclear Science & History
Alphas, Betas and Gammas Oh, My!
Referring to the periodic table of elements, nuclear physics learners determine the resulting elements of alpha and beta decay. Answers are given in atomic notation, showing the atomic symbol, mass, atomic number, and emission particles....
Wisconsin Online Resource Center
Oversized Inch
Each member of the class creates their own paper ruler. Using their ruler, kids walk around the room measuring the objects you've specified. Discuss how items should be measured to the 16th of an inch, the smallest unit on their ruler....
Illustrative Mathematics
Voting for Three, Variation 2
Here is another opportunity for math students to apply reasoning to solve real-world problems with ratios. The ratio of the number of votes for two candidates is provided. Your class is asked to use this ratio and information given about...
Illustrative Mathematics
Which Weighs More? Which Weighs Less?
Expand the the comparative language of young mathematicians with a hand-on weight measurement activity. Working independently or in pairs, children compare the weight of large wooden blocks to various other classroom objects, recording...
Illustrative Mathematics
US Garbage, Version 1
An interesting example of a discrete function and how it is applies to the real world. This could easily make a good collaborative lesson with an environmental science class. Practice reading a table and drawing a scatter plot make up...
Curated OER
Are You Full of Hot Air?
Explore the concept of measuring and recording circumference. In this physical science and measurement lesson, young learners blow up balloons, measure the circumference, and record the data on an interactive graphing website.
Curated OER
The Notorious Four-Color Problem
Take a walk through time, 1852 to 2005, following the mathematical history, development, and solution of the Four-Color Theorem. Learners take on the role of cartographers to study a United States map that is to be colored. One rule: no...
Illustrative Mathematics
Ratio of Boys to Girls
How many boys are in the class? Here is an introductory exercise describing ratios. The commentary shows different ways learners can approach the problem, using a tape diagram of boys to girls and using a table. The activity includes...
Curated OER
Molas
Seventh graders apply their prior knowledge of the Principle of Balance to create a paper mola. Students examine a variety of molas, which are fabric works of art made by women in the country of Panama. To arrange the composition of the...
EngageNY
Summarizing a Data Distribution by Describing Center, Variability, and Shape
Put those numbers to work by completing a statistical study! Pupils finish the last two steps in a statistical study by summarizing data with displays and numerical summaries. Individuals use the summaries to answer the statistical...
EngageNY
Using a Curve to Model a Data Distribution
Show scholars the importance of recognizing a normal curve within a set of data. Learners analyze normal curves and calculate mean and standard deviation.
Curated OER
Number and Operations- Using Gift Certificates
Students apply number and operation skills to learn how to spend a gift certificate. In this mathematical reasoning lesson, students use base 10 blocks as money and calculate how much money they have.
Curated OER
Application of Graph Theory
Students investigate different online tutorials as they study graphing. In this graphing lesson, students apply the concept of graphs cross curricular and use it to make predictions. They define the purpose and theories behind graphs.
Illustrative Mathematics
Running at a Constant Speed
The learner must use the given constant speed to find the unit rate. A table is made in order to relate the speed to the time and the distance. From the table, learners are able to see the unit rate in miles per minute and miles per...
Curated OER
Data Analysis, Probability, and Discrete Mathematics: Lesson 4
Eighth graders investigate the concepts of probability while performing data analysis. They apply statistical methods in order to measure or predict some possible outcomes. The information is collected and graphed, 8th graders analyze...
Curated OER
Guess and Test/Make a Table
Students explore problem solving strategies. In this middle school mathematics instructional activity, students investigate the guess and test and make a table problem solving strategies. Students work in pairs to apply the problem...
Curated OER
Apply Scientific Inquiry and Scientific Habits of Mind
Students review the components of the scientific inquiry method. In groups, they apply this method to various experiments they are given to complete. They also use the correct scientific habits of mind when researching different concepts.
EngageNY
Multiplying and Factoring Polynomial Expressions (part 2)
If you can multiply binomials, you can factor trinomials! This is the premise for a instructional activity on factoring. Pupils look for patterns in the binomials they multiply and apply them in reverse. Examples include leading...
EngageNY
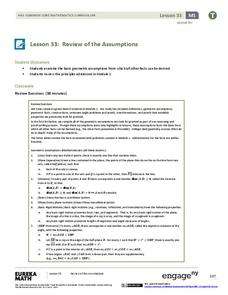
Review of the Assumptions (part 1)
What was the property again? Tired of hearing this from your pupils? Use this table to organize properties studied and as a reference tool for individuals. Learners apply each property in the third column of the table to ensure their...
EngageNY
Connecting Graphical Representations and Numerical Summaries
Which graph belongs to which summary statistics? Class members build upon their knowledge of data displays and numerical summaries to connect the two. Pupils make connections between different graphical displays of the same data in the...
NASA
Connecting Models and Critical Questions
Scholars use data to analyze and determine which sets of information need to be counted. They create a model to explain differences among chemical elements using graphs to prove concept mastery.
EngageNY
Why Call It Tangent?
Discover the relationship between tangent lines and the tangent function. Class members develop the idea of the tangent function using the unit circle. They create tables of values and explore the domain, range, and end behavior of the...
EngageNY
Correspondence and Transformations
Looking for a strategy to organize the information related to transformations? The materials ask pupils to identify a sequence of rigid transformations, identify corresponding angles and sides, and write a congruence statement. They...


