Cornell University
Constructing and Visualizing Topographic Profiles
Militaries throughout history have used topography information to plan strategies, yet many pupils today don't understand it. Scholars use Legos and a contour gauge to understand how to construct and visualize topographic profiles. This...
Polar Trec
Playground Profiling—Topographic Profile Mapping
The Kuril islands stretch from Japan to Russia, and the ongoing dispute about their jurisdiction prevents many scientific research studies. Scholars learn to create a topographic profile of a specific area around their schools. Then they...
Polar Trec
Create a Topographic Profile of Beacon Valley
Landforms in Beacon Valley, Antarctica, where there is no snow, bear a striking resemblance to landforms found on Mars. Scholars identify landforms found in Beacon Valley through analysis of topographic maps in the activity. They then...
Curated OER
Topographic Maps
Your choice of hands-on topographic mapping tasks is provided in this resource. From actual map-making to viewing and interpreting stereographic photos, the activities are sure to succeed. To make the most of this lesson, you will need...
Curated OER
Student Exploration: Building Topographic Maps
For this earthquake exploration worksheet, students complete 2 prior knowledge questions, then use "Building Topographic Maps Gizmo" to conduct several activities, completing short answer questions when finished.
Curated OER
Contour Map Worksheet #2
Following a contour map of a hill, a stream, and the ocean, are five multiple choice questions. Earth science enthusiasts determine elevation, direction of water flow, distance, and steepness. They also match the map to a selection of...
Curated OER
Fossil Fuels (Part II), The Geology of Oil: Topographic Mapping, Crustal Deformation, Rock Porosity, and Environmental Pollution
Students review an interpretation of geologic history and relate it to the formation of oil deposits. They explore and explain factors controlling the porosity and permeability of sediments and sedimentary rocks. Pupils also interpret...
Curated OER
Contour Map Worksheet #4
There are only four questions here. There is a contour map of Cottonwood, Colorado and the creek that crosses it. Earth scientists tell in what direction the creek flows, identify the highest elevation on the map, draw a topographic...
Curated OER
Fossil Fuels (Part II), The Geology of Oil
More of a mini-unit than a lesson, these activities lead inquisitors through a survey of oil deposits. In the first part, they read about and view diagrams of sedimentary rock layers that trap oil. Next, they test porosity and...
Curated OER
Making Topographic Maps and Mountain Profiles
Students study how to mark inclines and construct a mountain profile. In this topographic map lesson students mark contour intervals and draw mountain profiles.
Curated OER
Understanding Topographic Maps
Young scholars are introduced to the characteristics and uses of topographical maps. Using a worksheet, they examine the use of specific terminology and use cutouts to create their own topographical map of an area. They answer...
Curated OER
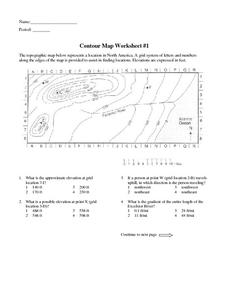
Contour Map Worksheet #1
Being able to read a topographic map is a standard in middle school earth science units and imperative for outdoor enthusiasts. As you introduce learners to this skill, you can assign this as an assessment or reinforcement. Pupils view a...
Curated OER
Contour Map Worksheet #3
Earth scientists answer five multiple choice questions about the topographical map atop the worksheet. Use this as a quick assessment of understanding after having taught how to read contour lines and topographic maps.
Curated OER
Mapping the Aegean Seafloor
Earth science learners create a two-dimensional topographic map of the floor of the Aegean Sea. They use it to then create a three-dimensional model of the ocean floor features. This comprehensive resource delivers strong background...
Curated OER
Generate an Accurate Landscape Profile from a Topographic Map
Students enerate an accurate landscape profile from a topographic map. They determine the correct interval needed to accurately graph the change in elevation on a single piece of graph paper.
Curated OER
Mapping
Introduce middle or high schoolers to topographic maps with this PowerPoint. After a review of longitude and latitude, display and describe contour lines and intervals. Also explain map scale. This is a useful presentation for a social...
Curated OER
A Question of Rivers
Interactive PowerPoints are terrific tools for self quizzing before an exam. This particular presentation is about the action and physical features of rivers. There are nine boxes to click on, each leading to a picture or map. When you...
Curated OER
Ocean Botttom Profile
Students interpret a graph of ocean depths and topographic features. This task assesses students' abilities to interpret figures, organize and represent data, apply knowledge of scale to a profile, and apply theoretical knowledge.
Wind Wise Education
Where is it Windy?
How is the wind up there? The class builds a topography model using materials available in the classroom, then place wind flags in different locations on the landscape. Using a fan as a wind source, pupils collect data about how wind...
Curated OER
Candy Bar Subsurface Geology
High schoolers are introduced to drawing and interpreting topographical maps. They each cut through there Jell-o mountain at regular height intervals, and trace around the shape of the Jell-o cut off at the height, overlaying the...
Curated OER
Geologic cross section of Manhattan, NYC
High schoolers draw an accurate geologic cross section by using a given data table. They relate the features of the cross section to geologic processes. Students then relate the characteristics of the bedrock to the architecture.
Curated OER
Lesson 2 Activity 2: Mapping Mount St. Helens
Students use topographic map skills to interpret impact of the May 18, 1980 eruption of Mount St. Helens on the volcano's topography, and draw profile views of Mount St. Helens before and after the May 18, 1980, eruption.
Curated OER
Mapping Mount St. Helens
Students study topographic maps and contour lines and construct a simple three-dimensional model of Mount St. Helens before the May 18, 1980, eruption. They use topographic map skills to interpret the impact of the May 18, 1980, eruption...
Global Change
Impact of Climate Change on the Desert Pupfish
A fish that lives in the desert? You and your class can meet the desert pupfish as they examine its habitat, the role humans play in diminishing water supplies, and how climate change might impact this fishy friend. There are four short...


