Chicago Botanic Garden
Recent Weather Patterns
Decide whether weather is changing! A two-part activity first challenges classes to review the differences between weather and climate. Once finished, individuals then analyze historical data to determine if climate change is happening...
NOAA
Climate, Weather…What’s the Difference?: Make an Electronic Temperature Sensor
What's the best way to record temperature over a long period of time? Scholars learn about collection of weather and temperature data by building thermistors in the fourth installment of the 10-part Discover Your Changing World series....
Curated OER
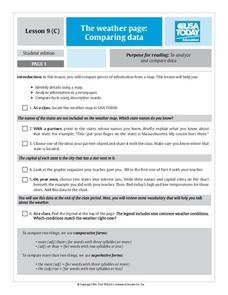
The Weather Page: Comparing Data
Young scholars analyze data from maps. In this comparing data lesson, students use comparative and superlative statements to draw comparisons among the weather in different American cities based on USA Today weather maps.
Teach Engineering
Air Under Pressure
Introduce your class to air masses and how they affect the weather with a activity that focuses on the differences between high and low air pressure systems. The class explores actual weather data using archived weather data.
NASA
The Types of Clouds and What They Mean
Learn to forecast the weather using cloud types. Budding meteorologists identify cloud types and learn to use a dichotomous key. As scholars develop observation and identification skills, they discover how different cloud types cause...
Curated OER
Weather and Climate
It's hot today, but is that the weather or the climate? This colorful presentation isolates both concepts to allow for better understanding by covering the positioning of the planet, making comparisons of land versus water, and looking...
Curated OER
Weather Watchers WebQuest
Students explore a variety of weather websites, and complete a Weather WebQuest worksheet. They read and analyze weather data, prepare a weather forecast and daily weather report, and predict the weather for the next two days.
Discovery Education
How's the Weather?
Young meteorologists explore different aspects of the weather while learning about measurement devices. They build instruments and then set up a weather station outside and measure temperature, humidity, air pressure, wind speed, and...
International Technology Education Association
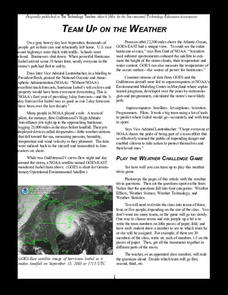
Team Up on the Weather
There's a little bit about every aspect of weather in this trivia game. The lesson resource provides 36 questions and answers pertaining to four different topics related to weather: effects, science, technology, and statistics. Groups...
Museum of Science
Weather Station
Find out what it is like outside before braving the elements. Teachers follow directions to build a barometer, rain gauge, and anemometer. Class members use the built weather instruments along with a thermometer to record weather...
Curated OER
Isolines on a Weather Map
Ninth graders recognize isolines on a weather map and draw isolines based on temperature data on a weather map. They draw isotherms on a weather map to identify temperature patterns.
National Park Service
Weather Patterns of the Pacific Ocean
How do oceans affect weather patterns? Learners define vocabulary associated with dew point, topographical lifting, condensation, and formation of clouds and precipitation as they explore the weather in the Pacific Northwest. They also...
Curated OER
Figure This! Math Challenges for Families
Young mathematicians complete a family math challenge packet. They will complete a packet of mixed math activities. They work with graphs, comparing numerical data, tessellations, and probability.
National Wildlife Federation
When It Rains It Pours More Drought and More Heavy Rainfall
Which is worse — drought or flooding? Neither is helpful to the environment, and both are increasing due to climate change. The 16th instructional activity in a series of 21 covers the average precipitation trends for two different...
National Wildlife Federation
Wherefore Art Thou, Albedo?
In the sixth lesson in a series of 21, scholars use NASA data to graph and interpret albedo seasonally and over the course of multiple years. This allows learners to compare albedo trends to changes in sea ice with connections to the...
Curated OER
Using Data Loggers
In this weather data worksheet, students use this worksheet to record data about temperature, wind speed, and more. Students complete 18 spaces on the chart.
Space Awareness
The Climate in Numbers and Graphs
Weather versus climate: weather relates to short time periods while climate averages the weather of a period of many years. Scholars learn about average temperature and precipitation in various climate zones and then apply statistics...
Radford University
A Change in the Weather
Explore the power of mathematics through this two-week statistics unit. Pupils learn about several climate-related issues and complete surveys that communicate their perceptions. They graph both univariate and bivariate data and use...
Curated OER
Weather's Outer Limits
Students make educated guesses and explain their reasoning and compile, graph, and map weather data. They then study environmental weather extremes on earth and discover that many variables determine climate.
Curated OER
Current Weather
A great year around activity that shows young mathematicians how the math skills they are learning are actually used in the real world. This exercise also helps learners begin to distinguish the difference between weather and climate. As...
Curated OER
How Does the Earth's Energy Budget Relate to Polar Ice?
Students use satellite data to see how radiation budget relates to the ice that is present in the North. In this energy lesson students correlate data to see a relationship.
Curated OER
2nd Grade - Act. 28: Calendar & Weather Book
Second graders will track the weather patterns throughout the school year. This project spans the school year and takes five minutes per day or less. Measuring, data collection, and predictions are all explored throughout this relevant...
Curated OER
Graphing the Forecast-Line Graph or Bar Graph?
Learners explore bar and line graphs. In this data collection, graphing, and weather lesson, students compare bar and line graphs and discuss which type of graph would be most appropriate for displaying a ten day weather forecast....
Curated OER
Weathering Lab
Assist your middle school class with one of the most inclusive weathering and erosion labs available. Individuals use sugar cubes and alka-seltzer to demonstrate the process of physical and chemical weathering. They sketch results...
Other popular searches
- Collect Data Weather
- Recording Weather Data
- Collecting Weather Data
- Graphing Weather Data
- Weather Data Collection
- Data About Weather
- Analyzing Weather Data
- Math Data Graph Weather
- Weather Data Projects
- Gathering Weather Data
- Weather Log Data Sheets
- Data Analysis Weather


