Science Education Resource Center at Carleton College
Serc: Simple vs. Compound Interest Spreadsheeting the Difference
A lesson plan that includes a PowerPoint learning module for students. The goal of the lesson is to learn the difference between simple and compound interest and to use the functions in Excel to perform the calculations and graph the data.
Science Education Resource Center at Carleton College
Serc: Calzones vs. Mini Pizzas a Linear Programming Problem
This module presents a linear programming problem. An example of the revenue-maximizing product mix for a pizza parlor is developed. This is an example of a more general mathematical optimization (maximization or minimization) problem....
Science Education Resource Center at Carleton College
Serc: The Digital Divide: A Data Analysis Activity Using Subtotals
A lesson plan that includes a PowerPoint learning module for students. The purpose of the instructional activity is to teach how to use Excel to analyze a large amount of data, in this case from the US Census. The example being used is...
Science Education Resource Center at Carleton College
Serc: The Mole in Chemistry: Determining the Number of Atoms in Everyday Items
Students explore the concept of the mole as a measure of quantity. They build spreadsheets that allow them to convert between moles, grams, and atomic mass units for given quantities of everyday items, elements, and simple chemical...
Science Education Resource Center at Carleton College
Serc: The "Perfect" Date: Ranking and Rating Decisions With a Spreadsheet
A lesson plan that includes a PowerPoint learning module for students. The purpose of the lesson is to use spreadsheets to explore a rating and ranking method for choosing someone to date. They look at the problems that arise when...
Science Education Resource Center at Carleton College
Serc: Fluid Viscosity
To give students a feeling for both what viscosity values are and how they are measured in the lab, they measure fluid viscosity by dropping ball bearings into graduated cylinders of fluids.
Science Education Resource Center at Carleton College
Serc: Using Your Marbles: Making Energy Work for You
This activity is based on the common experiment of running a marble down a ramp to do work on a cup. Students will be able to see the relationship between mass and energy of the marble and the ramp height.
Science Education Resource Center at Carleton College
Serc: Why Is the Earth Still Hot Inside?
In this lesson, students conduct heat transfer experiments to investigate why the Earth is still hot at its core, even after billions of years since its formation. They will learn that the rate of heat transfer is dependent on an...
Science Education Resource Center at Carleton College
Serc: Heat on the Move
This activity is meant to be one of many common experiences that help students understand that convection is a major driving force on our planet.
Science Education Resource Center at Carleton College
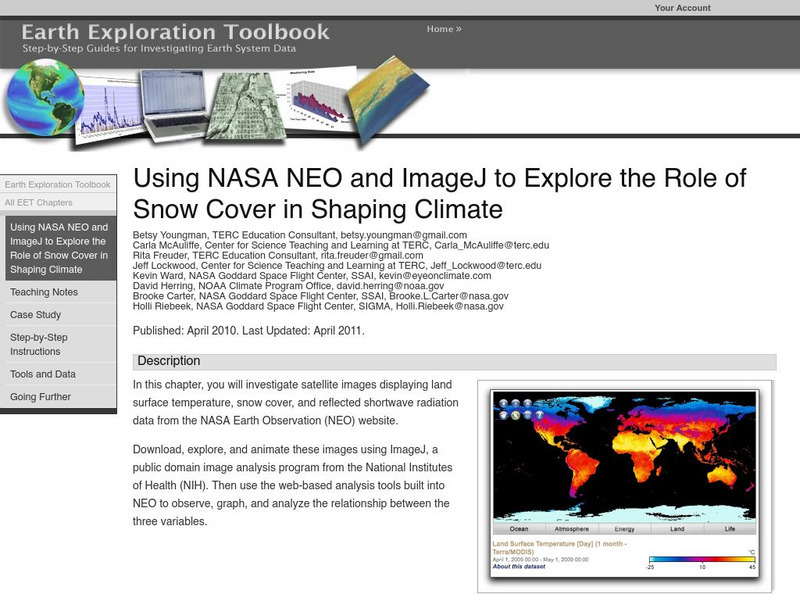
Serc: Using Nasa Neo and Image to Explore Role of Snow Cover in Shaping Climate
This lesson helps learners investigate satellite images displaying land surface temperature, snow cover, and reflected shortwave radiation data.
Science Education Resource Center at Carleton College
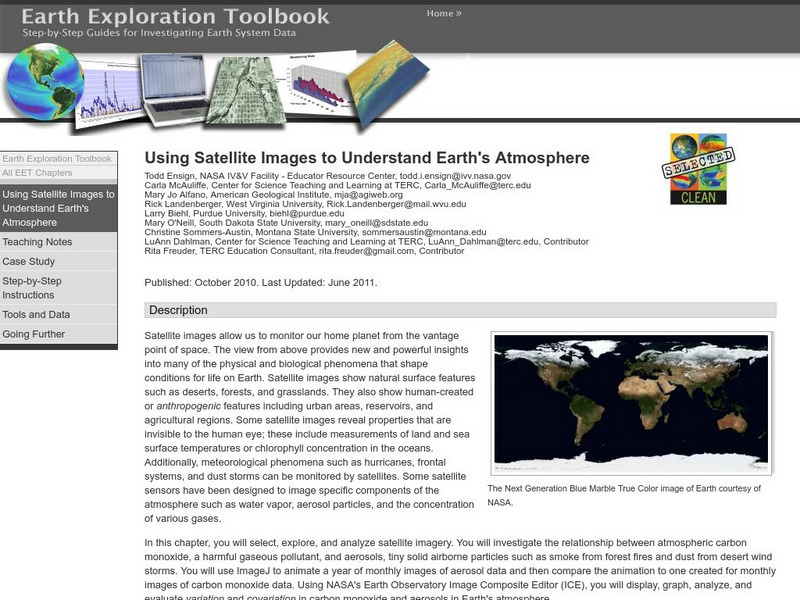
Serc: Using Satellite Images to Understand Earth's Atmosphere
This lesson helps young scholars select, explore, and analyze satellite imagery. Students investigate the relationship between atmospheric carbon monoxide and aerosols. Incorporate ImageJ to animate a year of monthly images of aerosol...
Science Education Resource Center at Carleton College
Serc: Exploring Air Quality in Aura No2 Data
This activity illustrates how data can be imported into Google Earth for visualization and interpretation. Students are introduced to air quality as it relates to population density and topography.
Science Education Resource Center at Carleton College
Serc: Visualizing Carbon Pathways
This lesson introduces students to visualization capabilities available through NASA's Earth Observatory, global map collection, NASA NEO and ImageJ. Students build several animations of satellite data that illustrate carbon pathways...
Science Education Resource Center at Carleton College
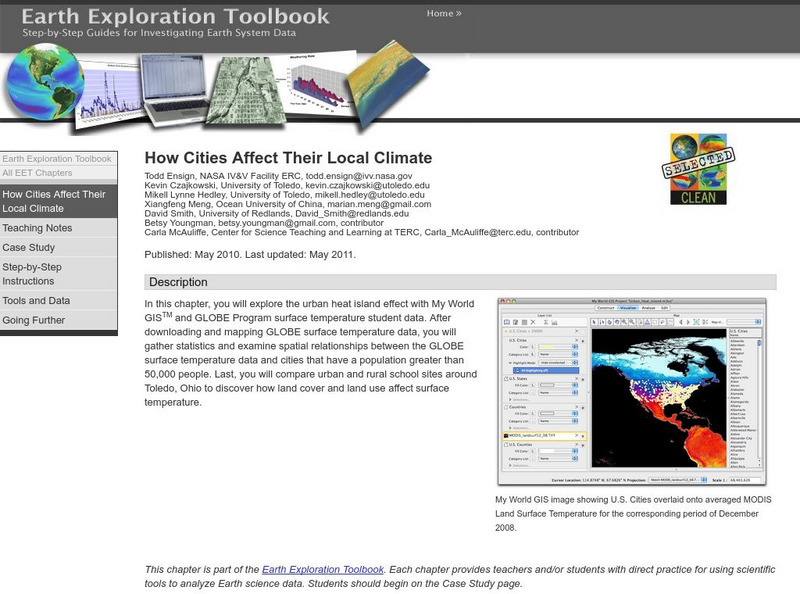
Serc: How Cities Affect Their Local Climate
Students explore the urban heat island effect with My World GISTM and GLOBE Program surface temperature student data. After completing this chapter, students will be able to successfully download GLOBE Program datasets in the...
Science Education Resource Center at Carleton College
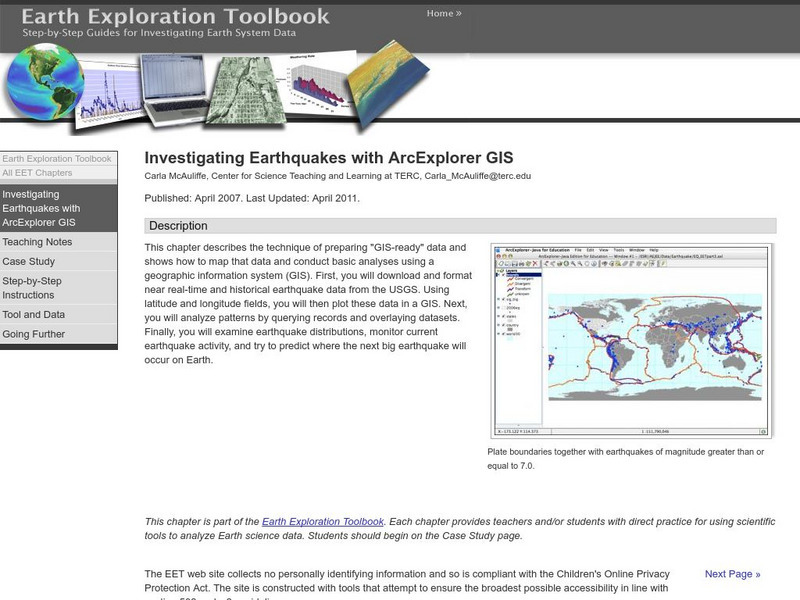
Serc: Investigating Earthquakes With Arc Explorer Gis
This activity allows students to predict future earthquake activity by interpreting the results of geographic information system (GIS) analysis.
Science Education Resource Center at Carleton College
Serc: Envisioning Climate Change Using a Global Climate Model
Young scholars run the climate modeling software, Educational Global Climate Modeling Suite (EdGCM), to visualize how temperature and snow coverage might change over the next century.
Science Education Resource Center at Carleton College
Serc: Understanding Carbon Storage in Forests
This lesson helps students learn about forest biomass and its role in carbon storage. Students will compare field-collected data with results produced by a forest biomass model to understand the process and challenges scientists face...
Science Education Resource Center at Carleton College
Serc: Exploring and Animating Goes Images
Students learn how to transform a series of GOES images into an animation, and how to create a storm track from that animation. By synthesizing information from the track and other sources, students determine storm speed and direction.
Science Education Resource Center at Carleton College
Serc: Creating Custom Map Images of Earth and Other Worlds
Become familiar with Jules Verne Voyager, a freely-available online map tool that includes data for Earth as well as several other planets and moons. Create a variety of map images and then save and import the images into a presentation...
Science Education Resource Center at Carleton College
Serc: Litter Retriever With a Gps Receiver
Have you ever wondered why litter is in some locations and not others? You will use a Global Positioning System (GPS) to mark the locations of trash and trash cans around a local park or school campus, import the data into Google Earth,...
Science Education Resource Center at Carleton College
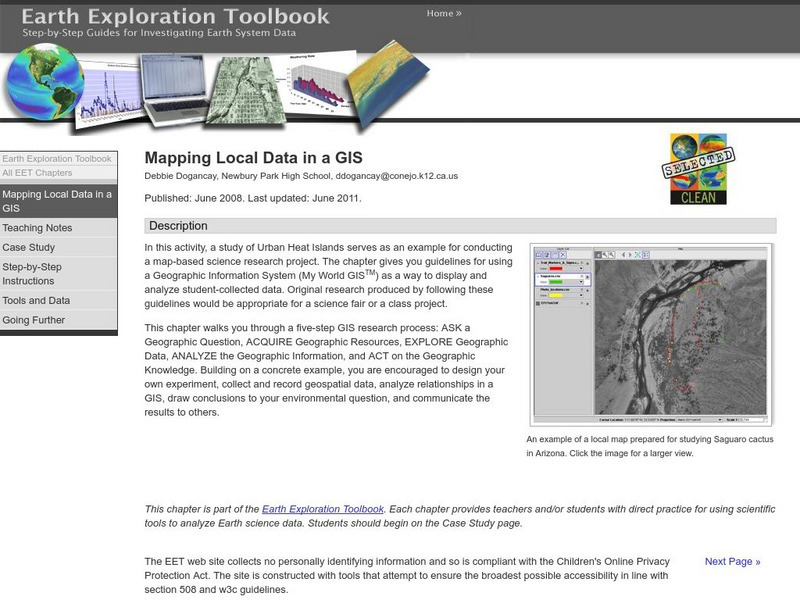
Serc: Mapping Local Data in a Gis
In this activity, students will learn how to conduct a map-based science research project using a Geographic Information System (GIS). They will design an experiment, collect and record geospatial data, analyze geospatial relationships...
Science Education Resource Center at Carleton College
Serc: Annotating Change in Satellite Images
This chapter walks you through a technique for documenting change detected in before-and-after sets of satellite images. The technique can be used for any set of images that show the same area at the same scale at different times.
Science Education Resource Center at Carleton College
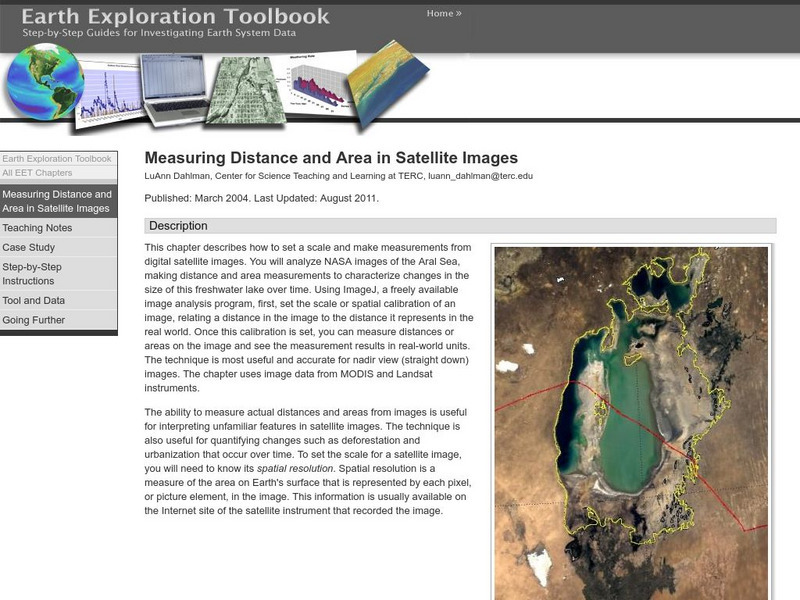
Serc: Measuring Distance and Area in Satellite Images
Students will select from a series of Satellite images of the Aral Sea from 1973 through 2003 and will measure changes in the area of the lake and distance across the lake over time.
Science Education Resource Center at Carleton College
Serc: Exploring Ncar Climate Change Data Using Gis
With ArcGIS and climate data from the National Center for Atmospheric Research Climate Change Scenarios GIS Data Portal, students learn the basics of GIS-based climate modeling.


