Balanced Assessment
Fermi Area
Discover creative ways to use surface area formulas. In the assessment task, scholars apply estimation strategies to determine surface area in non-routine problems. They consider surface area of kitchen sponges, rock salt crystals, and...
Balanced Assessment
Fermi Length
How long does it take to get to the end of a toilet paper roll? Pupils use their estimation strategies to find lengths of common items. For example, knowing the area of a roll of toilet paper, scholars determine the length of the full roll.
Balanced Assessment
Writing and Sketching Resource
Picture this—the class creates pictures using functions. Here, learners build functions to model specific graphic criteria. They use their knowledge of parent functions and transformations to create the perfect function.
Balanced Assessment
Multi-Graphs
So many things change as time goes by. Here, scholars create graphs based on this premise. Each problem asks pupils to sketch a graph that describes a given situation. Their graphs represent various characteristics such as height,...
Balanced Assessment
Sharp-Ness
Transform pupils into mathematicians as they create their own definitions and formulas. Scholars examine an assortment of triangles and create a definition and formula for determining the sharpness of the vertex angle. The groups of...
Balanced Assessment
Batting Orders
A baseball coach has more than 700 billion decisions to make before a game even starts, and in this resource individuals calculate the number of ways a coach can make a batting lineup. The first question places nine players out of nine....
Balanced Assessment
Movie Survey
Movie preferences will get your classes talking! Individuals read a pie graph and construct a bar graph using the same information. They then answer questions specific to the data and sample size.
Balanced Assessment
Time Line
Use a graph to tell a story! Given a graph, young scientists create a story to match. They must provide their own axes labels and description of the scenario. The graph has increasing, decreasing, and constant sections.
Balanced Assessment
Lotto
You can't win if you don't play! Find out how to increase your chances of winning the lottery. Scholars analyze a state lottery system for the probability of winning. They also consider different combinations of numbers and how they...
Balanced Assessment
Legos
How many ways can you arrange two six-hole Legos? Scholars practice their understanding of combinations as they investigate this question. As they create a plan, they develop a specific definition of a combination.
Balanced Assessment
Sloppy Student I
"Does this work every time?" We've all heard it. Now learners get to explore methods to answer that question themselves. Pupils analyze a mistake that has been made with creating a formula for multiplying binomials. They then create...
Balanced Assessment
Sales Tax Table
Sales tax rates vary; do the math to find the right rate! Pupils use before tax amounts and after tax amounts to determine the tax rate. Rounding makes the task challenging.
Balanced Assessment
Fermi Number
A fermi number is a rough estimate of a quantity that is difficult or impossible to measure. Individuals design a process for making an estimation of a given scenario. For example, they determine a plan for estimating the number of...
Balanced Assessment
Monitor Pricing
Out with the old and in with the new. Learners use a set of prices of computer monitors from 1994 to make a prediction. They then use one current price and what they know about the old prices to make a more recent prediction. Their...
Balanced Assessment
Number Trick
Show your classes the magic of numbers. Using a number trick, learners practice writing algebraic expressions. They then use their expression to perform the trick. Their exploration should help them understand the magic behind the trick.
Balanced Assessment
Marbles in a Glass
Allow learners to design their own strategies to solve a problem. Given dimensions of a glass and a smaller marble, scholars must find the dimensions of a larger marble. The answer key suggests using the Pythagorean Theorem, but multiple...
Balanced Assessment
Star from Square
Quilting is not only beautiful and unique—it is a mathematical art. Show your classes how to design a quilting block while practicing area and circumference of circles. Scholars create a star from a square and then find the circumference...
Balanced Assessment
Frosting on the Cake
Party planners need algebra too! Here, pupils decide the perfect size of a cake based on available ingredients. They use the concepts of area and perimeter to make their conclusions.
Balanced Assessment
Modern Building
Turn your pupils into emerging architects with a resource that asks learners to analyze a scale drawing of a building. They use the scale drawing to interpret the size of the actual building before recreating the drawing using a...
Balanced Assessment
Who's Left?
If you're not right-handed, are you wrong-handed? Young statisticians calculate the percentage of left-handed people using a given data set in the assessment task. They plot data on a scatter plot and consider how the line of best fit...
Balanced Assessment
Stick Patterns
Sticks and stones may break my bones, but these sticks will make me smarter. Pupils examine arrays of sticks to determine the next array in a pattern. They use the number of sticks added to each previous array to determine a recursive...
Balanced Assessment
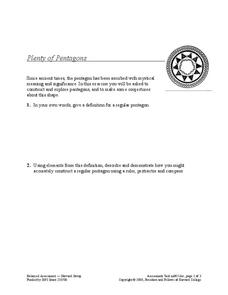
Plenty of Pentagons
Why are only four colors needed to color webs from regular pentagons, not five? An assessment task requires young mathematicians to first construct regular pentagons using a compass and straightedge, then has them consider a shape formed...
Balanced Assessment
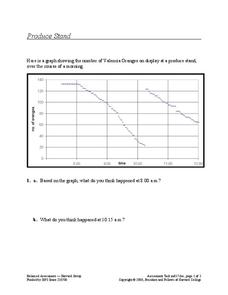
Produce Stand
Interpret a graph of the number of oranges at a produce stand to determine a likely event at different times. They also analyze the graph to determine which time period oranges were selling most quickly.
Balanced Assessment
How Big is Big?
Now you can create your own monster movie. Learners estimate the size of a scale model monster given comparison statements and analyze these estimates to determine if the scale model accurately portrays a lizard.


